Bitcoin weekly: Selling off, but $109k holding
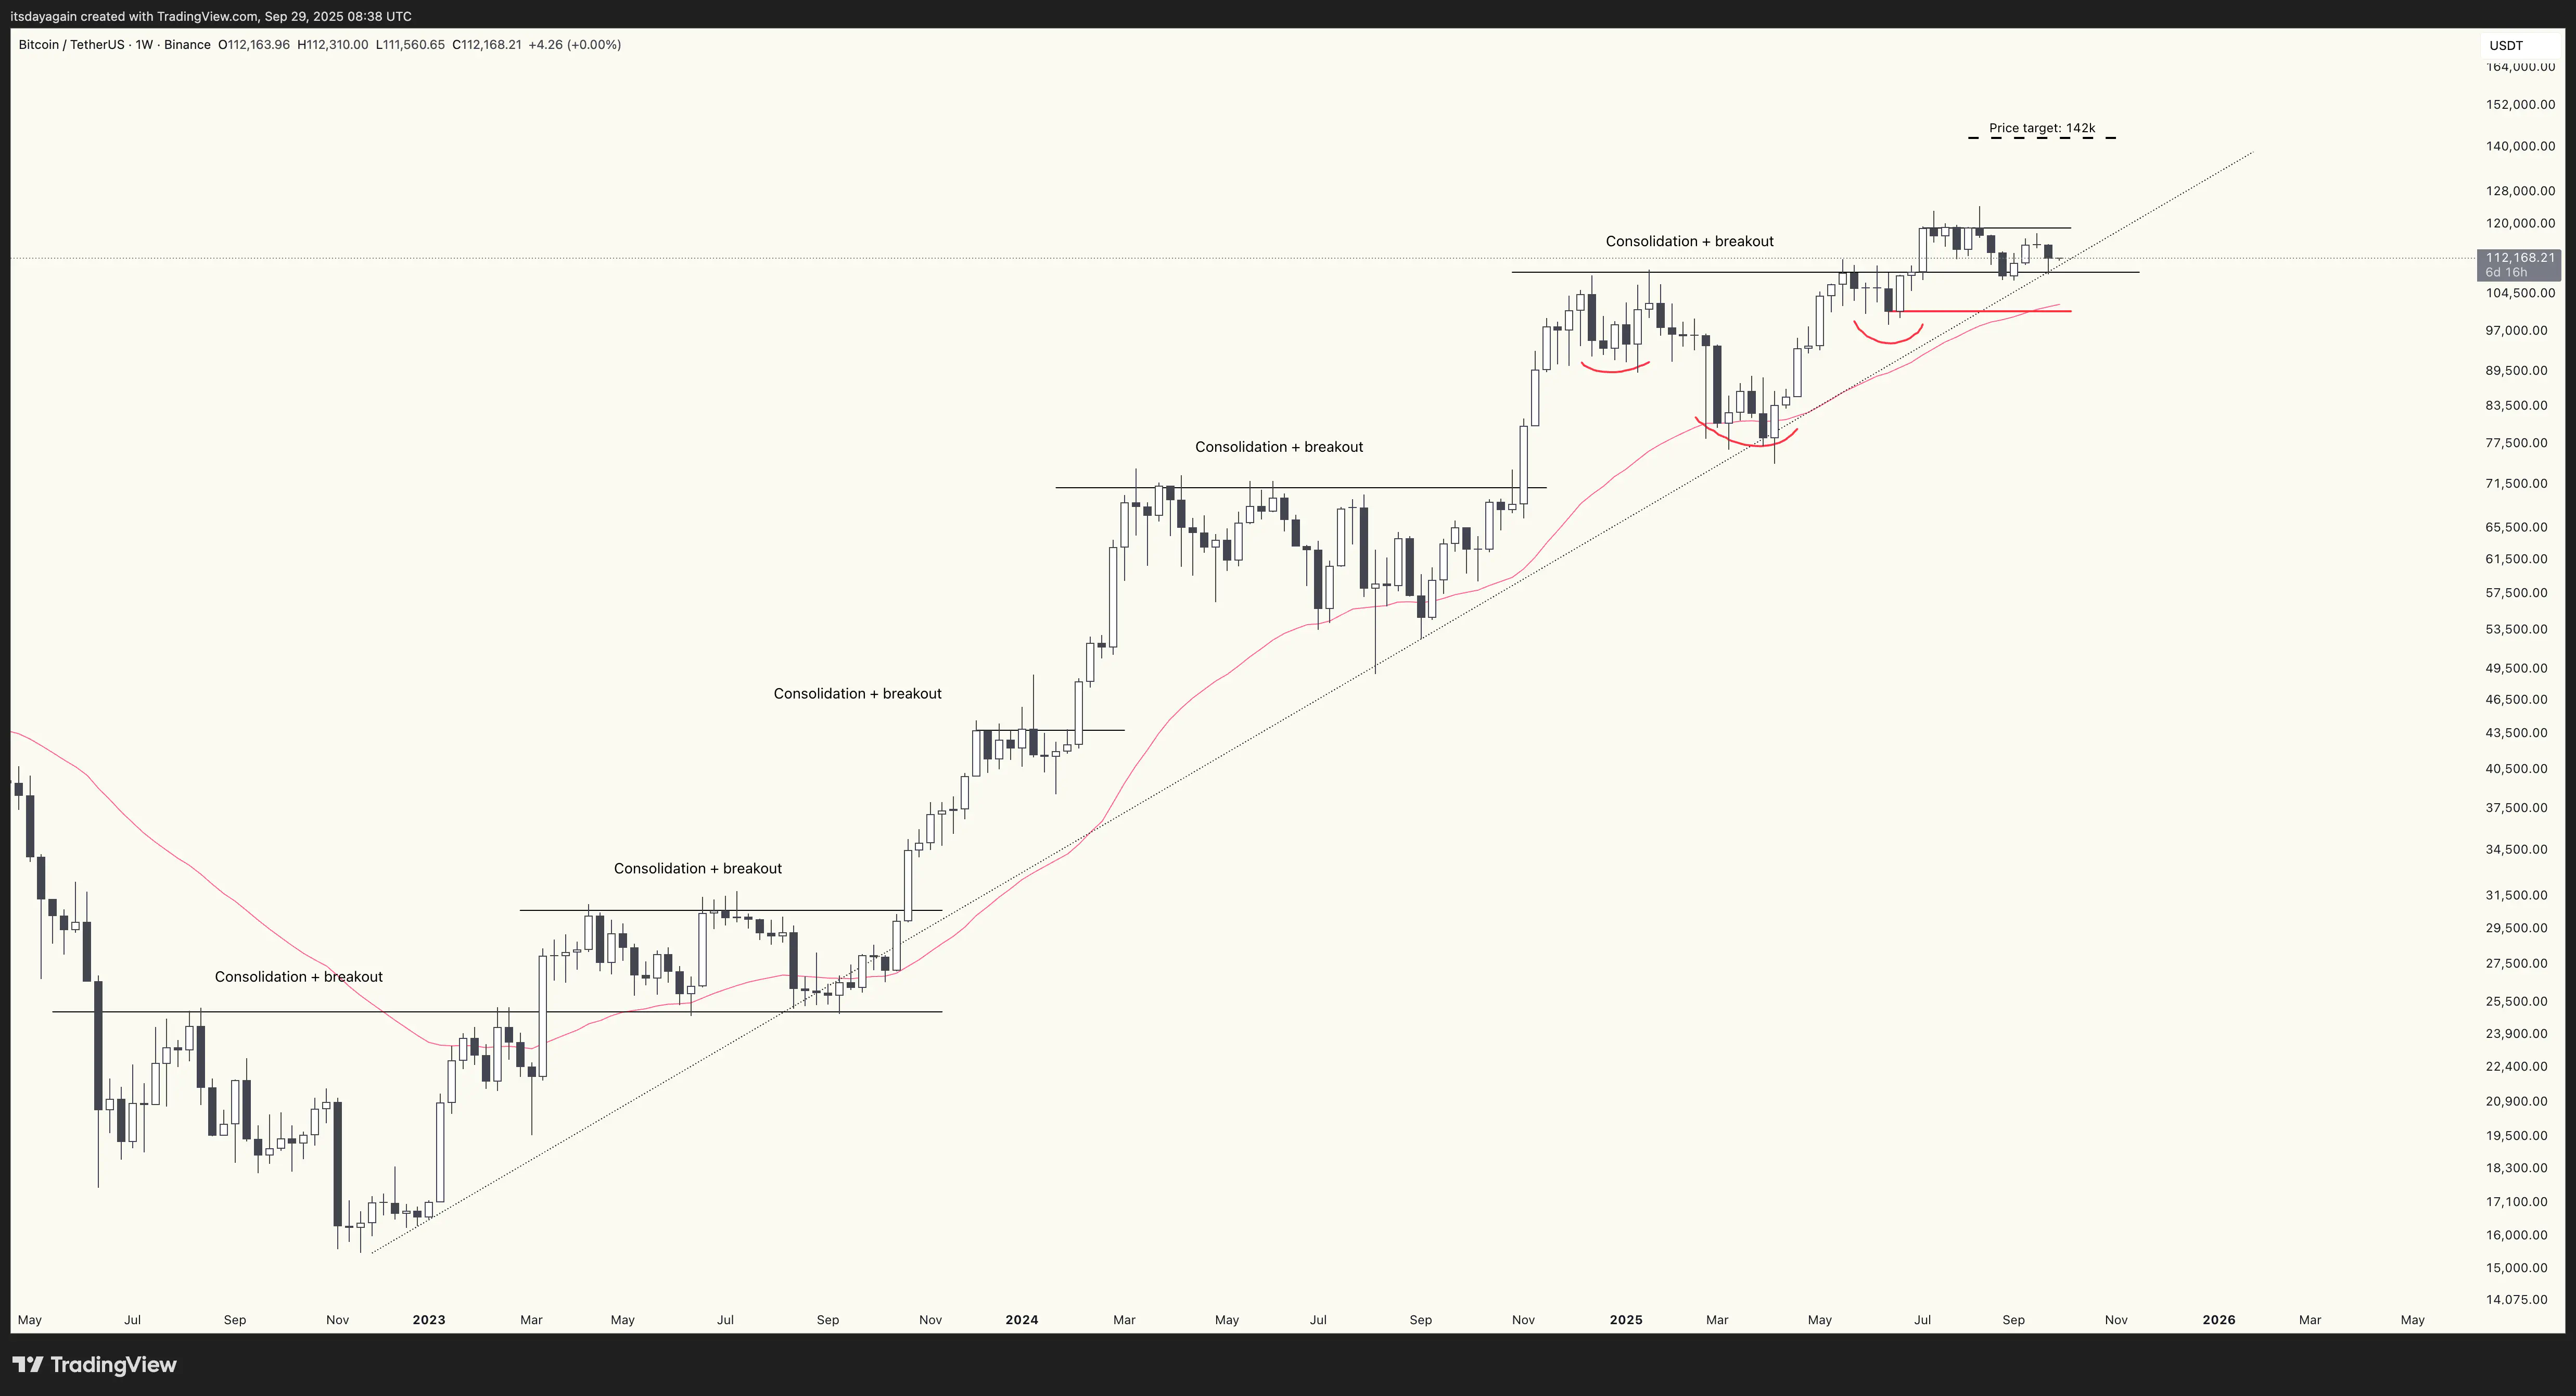
Last week, crypto dumped across the board as traders got liquidated left and right. Bitcoin dipped all the way down to retest the breakout level at $109k again. Not a show of strength, but for now support at the weekly chart is holding, and the price target remains at $142k.
Also watch the accompanying chart analysis on YouTube.
In the tradfi world, not much happened last week. Midweek, US GDP and jobs numbers came in a little bit better than expected, causing the market to slightly pare back expectations of rate cuts. Then on Friday, PCE inflation came in as expected.
Looking to the charts, US stock indices remain strong, with no signs of tops being in.
In crypto though, it was a different story. Last Monday morning, bitcoin started selling off heavily, and the rest of the crypto market followed right behind. The sell-off then continued throughout the week, before BTC stabilized around $109k on Friday. Total liquidations reached billions of dollar, as short term traders got wiped out of their positions.
On the weekly timeframe, however, the charts for bitcoin and the big alts still hold above key support levels. Although it is a sign of weakness that BTC retested $109k support again so soon, the breakout is still in play, and the price target of $142k remains.
So, what to make of all this? Well, let’s consider the situation:
- Crypto aggressively sold off across the board, but larger picture it still looks okay.
- Tradfi markets held up, not showing any particular signs of fear.
These two facts make last week’s dump look like a temporary correction, cause by market makers flushing out leveraged positions.
If this assessment is correct, crypto markets should turn up again within the next couple of weeks, with altseason resuming. I remain optimistic.