Bitcoin weekly: Historical flash crash
On Friday, bitcoin flash crashed all the way down to $100k, while altcoins got utterly annihilated. It was the biggest liquidation event ever in the entire history of crypto. But as dramatic as it was, in the end bitcoin recovered and closed the week at $115k, with the price target of $142k still intact.
Also watch the accompanying chart analysis on YouTube.
What a few weeks it’s been in the crypto market. A fakeout to the downside in late September was then followed by a week of rallying, culminating in a new bitcoin all time high last Monday. Everything looked good.
Until Friday afternoon.
That’s when the largest liquidation event in crypto history started. Seemingly triggered by news of a deepening trade conflict between the US and China, crypto started selling off along tradfi stocks. But unlike in stocks, where the dip was relatively mild, in crypto it escalated into the largest wipeout that has ever taken place in the entire history of crypto.
On Binance, the largest crypto exchange, USDT pairs of many multi-billion dollar altcoins wicked down 70-80% or even more, as altcoin traders got completely annihilated across the board.
This bloodbath has 100 meter tall neon signs flashing MARKET MANIPULATION all over it. This had nothing to do with China tariffs. That was just the trigger for deep-pocketed insiders to set off a cascade of liquidations. My guess is that it was several independent actors taking advantage of the situation. But in any event, a few people got a whole lot richer, while thousands of holders and traders got a whole lot poorer, as they were liquidated or sold in fear.
This event will be remembered in crypto history. But exactly how it will be remembered is still not clear. It could be the start of a downturn, or it could turn into a small blip in an ongoing bull market.
My guess is a small blip. Let’s have a look at what the charts say.
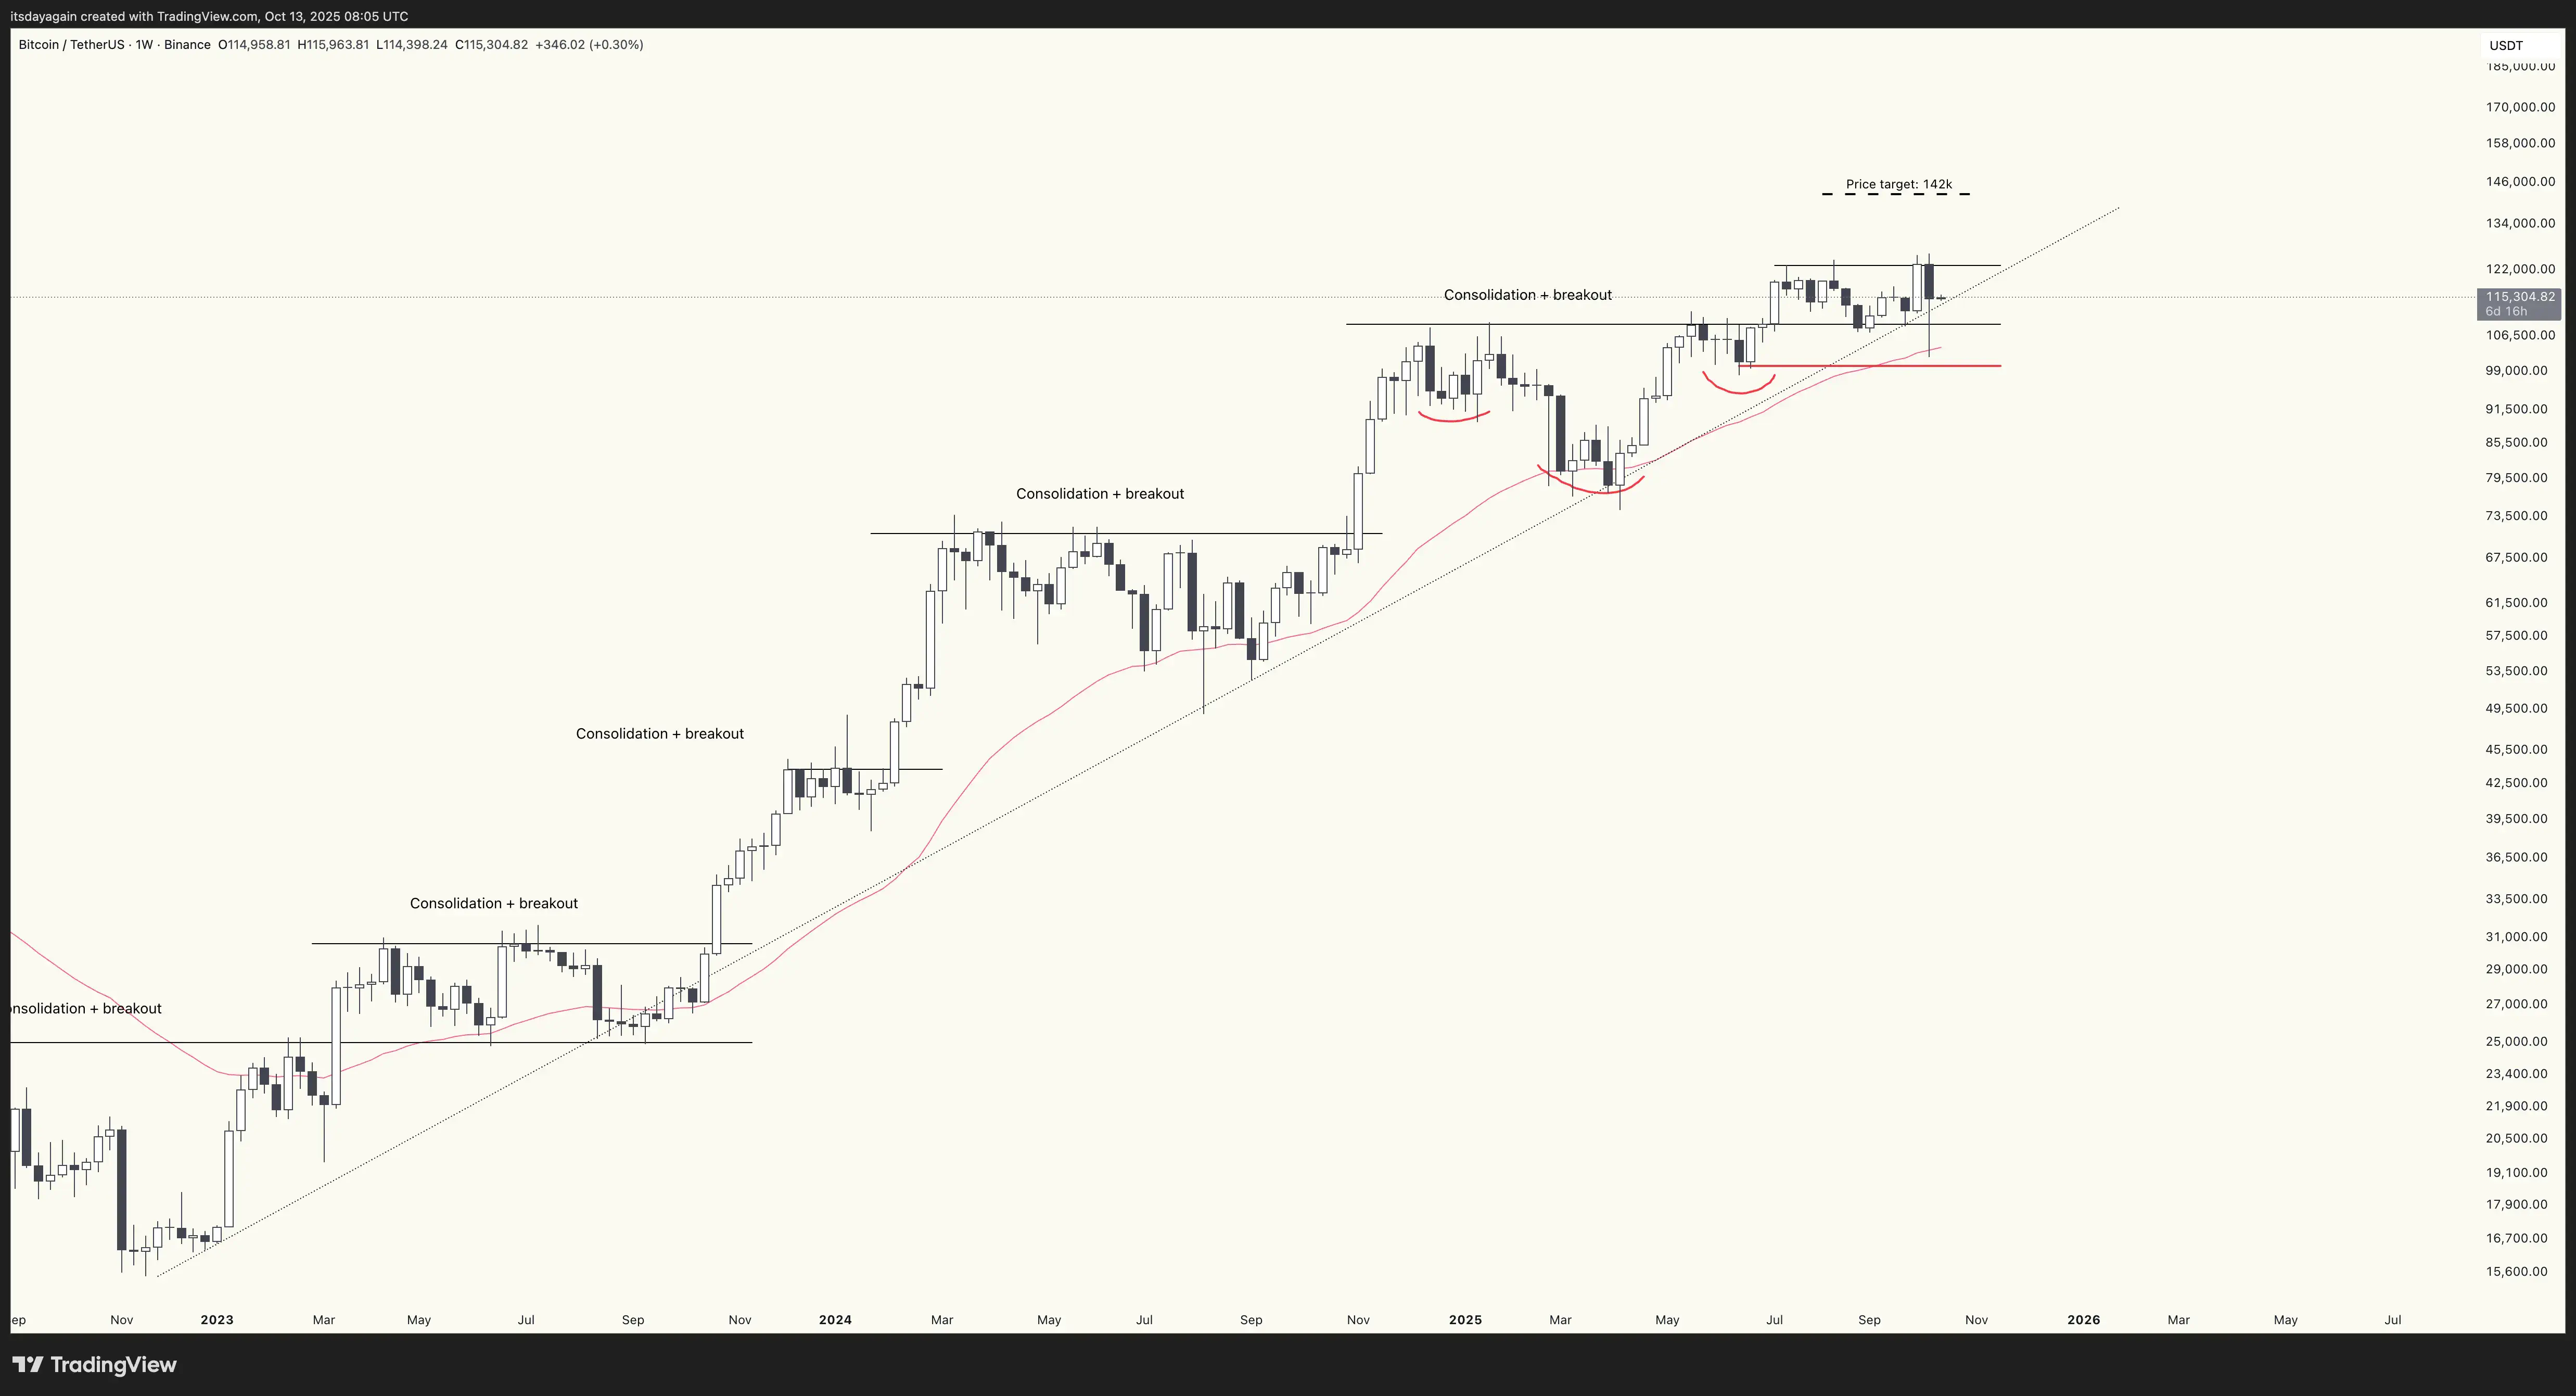
Despite the chaos, BTC held up relatively well. On some exchanges it dipped all the way down to $100k. But in the end it recovered, and the week closed Sunday night at $115k. Well above the $109k support level that has held since the breakout back in early July.
This means the inverse head and shoulders breakout is still in play, and the price target at $142k remains. As dramatic as Friday was, the bitcoin chart still holds up.
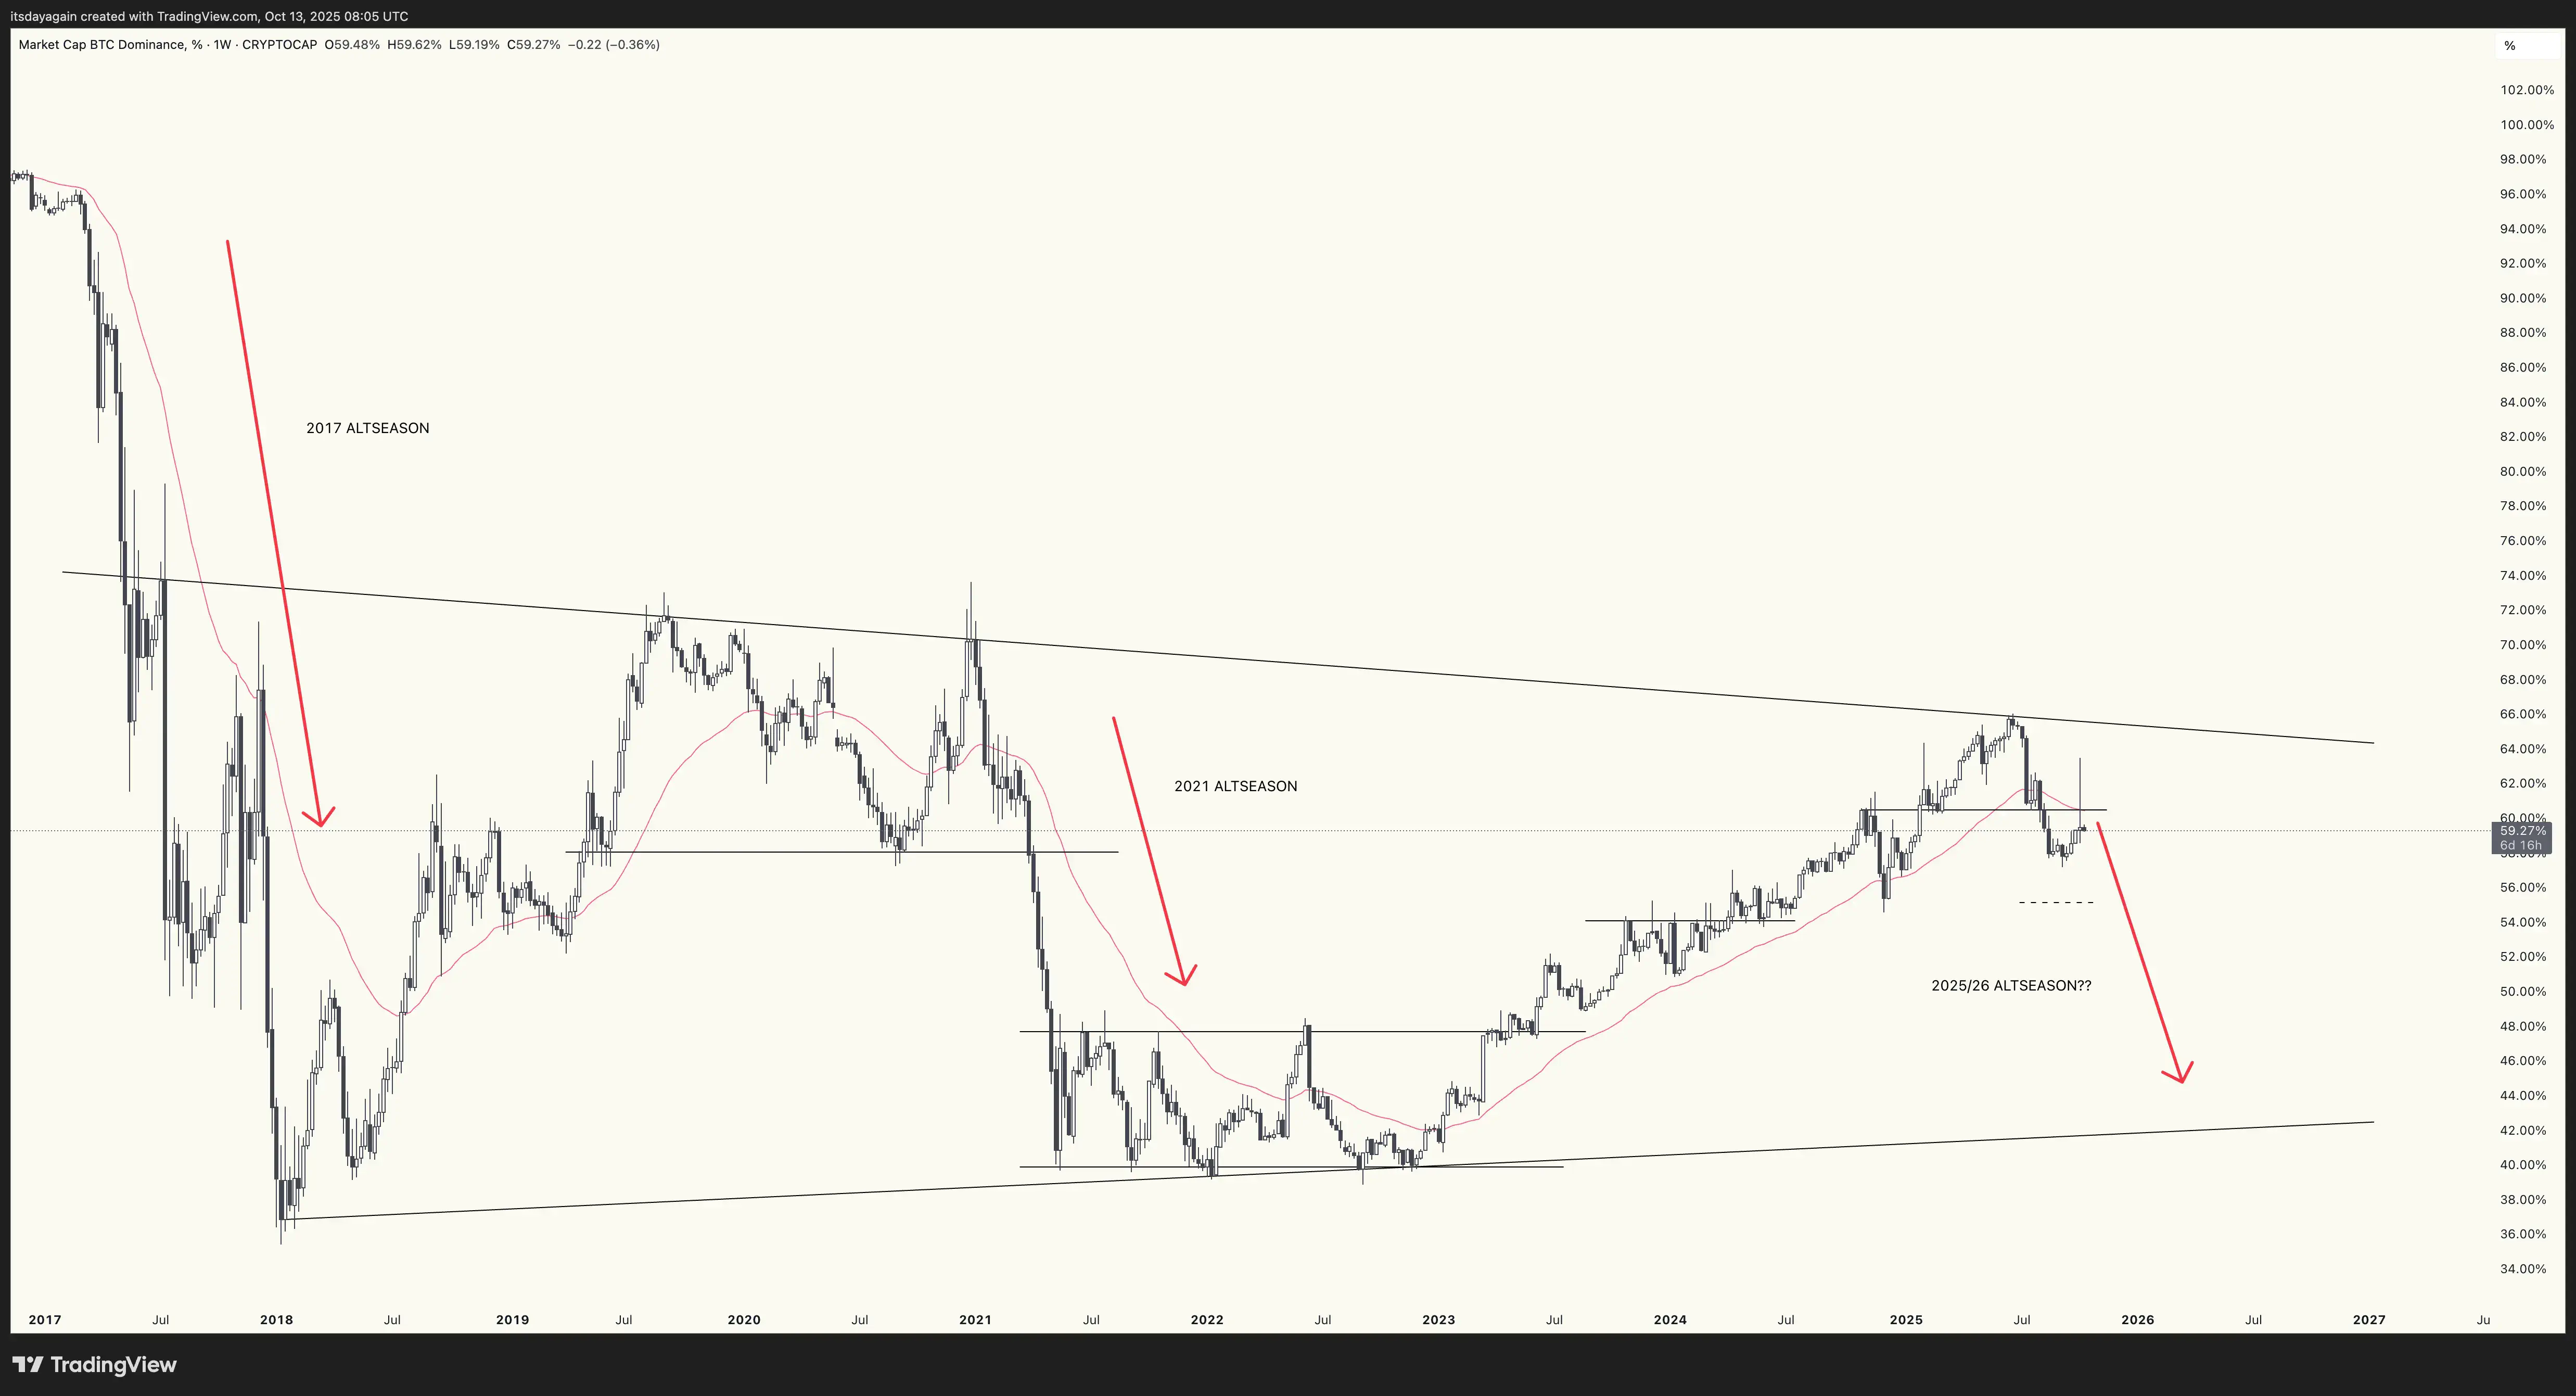
As altcoins were crushed on Friday, Bitcoin dominance (BTC.D) saw a sharp spike all the way up to 63.5%. However, it then quickly pulled back and closed the week at 59.5%, below the 40 week ema. This means the downtrend is intact, and altseason is still on.
So yes, for now, it looks to me like this bull market will continue.