Bitcoin weekly: Breakdown
A bad week for stocks, and even worse for crypto. Bitcoin broke down, and closed the week at $94.2k. The July breakout has now failed, and the price target of $142k is no longer in play. Last week’s call for patience now turns into a call for extreme caution.
Also watch the accompanying chart analysis on YouTube.
In tradfi, the US government shutdown ending mid-week failed to cheer the markets up. Instead they started pricing in lower expectations of a December rate cut, partly due to the lack of data caused by said shutdown.
This obviously didn’t help crypto, which saw a continued sell-off across the board.
Heading into the week, bitcoin held both the 50 week SMA, as well as the $100k breakout invalidation. This week, not so much. Bitcoin closed the week at $94.2k, well below the 40 week EMA, the 50 week SMA, and below the invalidation level for the July breakout. This means the price target of $142k is now no longer in play.
Not a pretty picture.
Could this be a fake-out to the downside, similar to the April low? Sure, it could. But there are two important differences compared to April that are worth noting here:
First, yesterday’s close marks the first failed breakout on the weekly chart going back all the way to the bottom in late 2022.
Second, this is the first time breaking down below the 50 week SMA since the start of the bull market back in March 2023.
Taken together, this is a significant shift, and it’s something we need to take seriously, no matter our fundamental views.
When a breakdown like this occurs, we have to assume it’s real, and switch to a bearish bias. Traders will now look to sell bounces, so any bounce from here should be assumed to get rejected at resistance. This bearish stance has to remain until the chart shows signs of turning around again. Either by reclaiming resistance levels, or by some other bottoming pattern occuring.
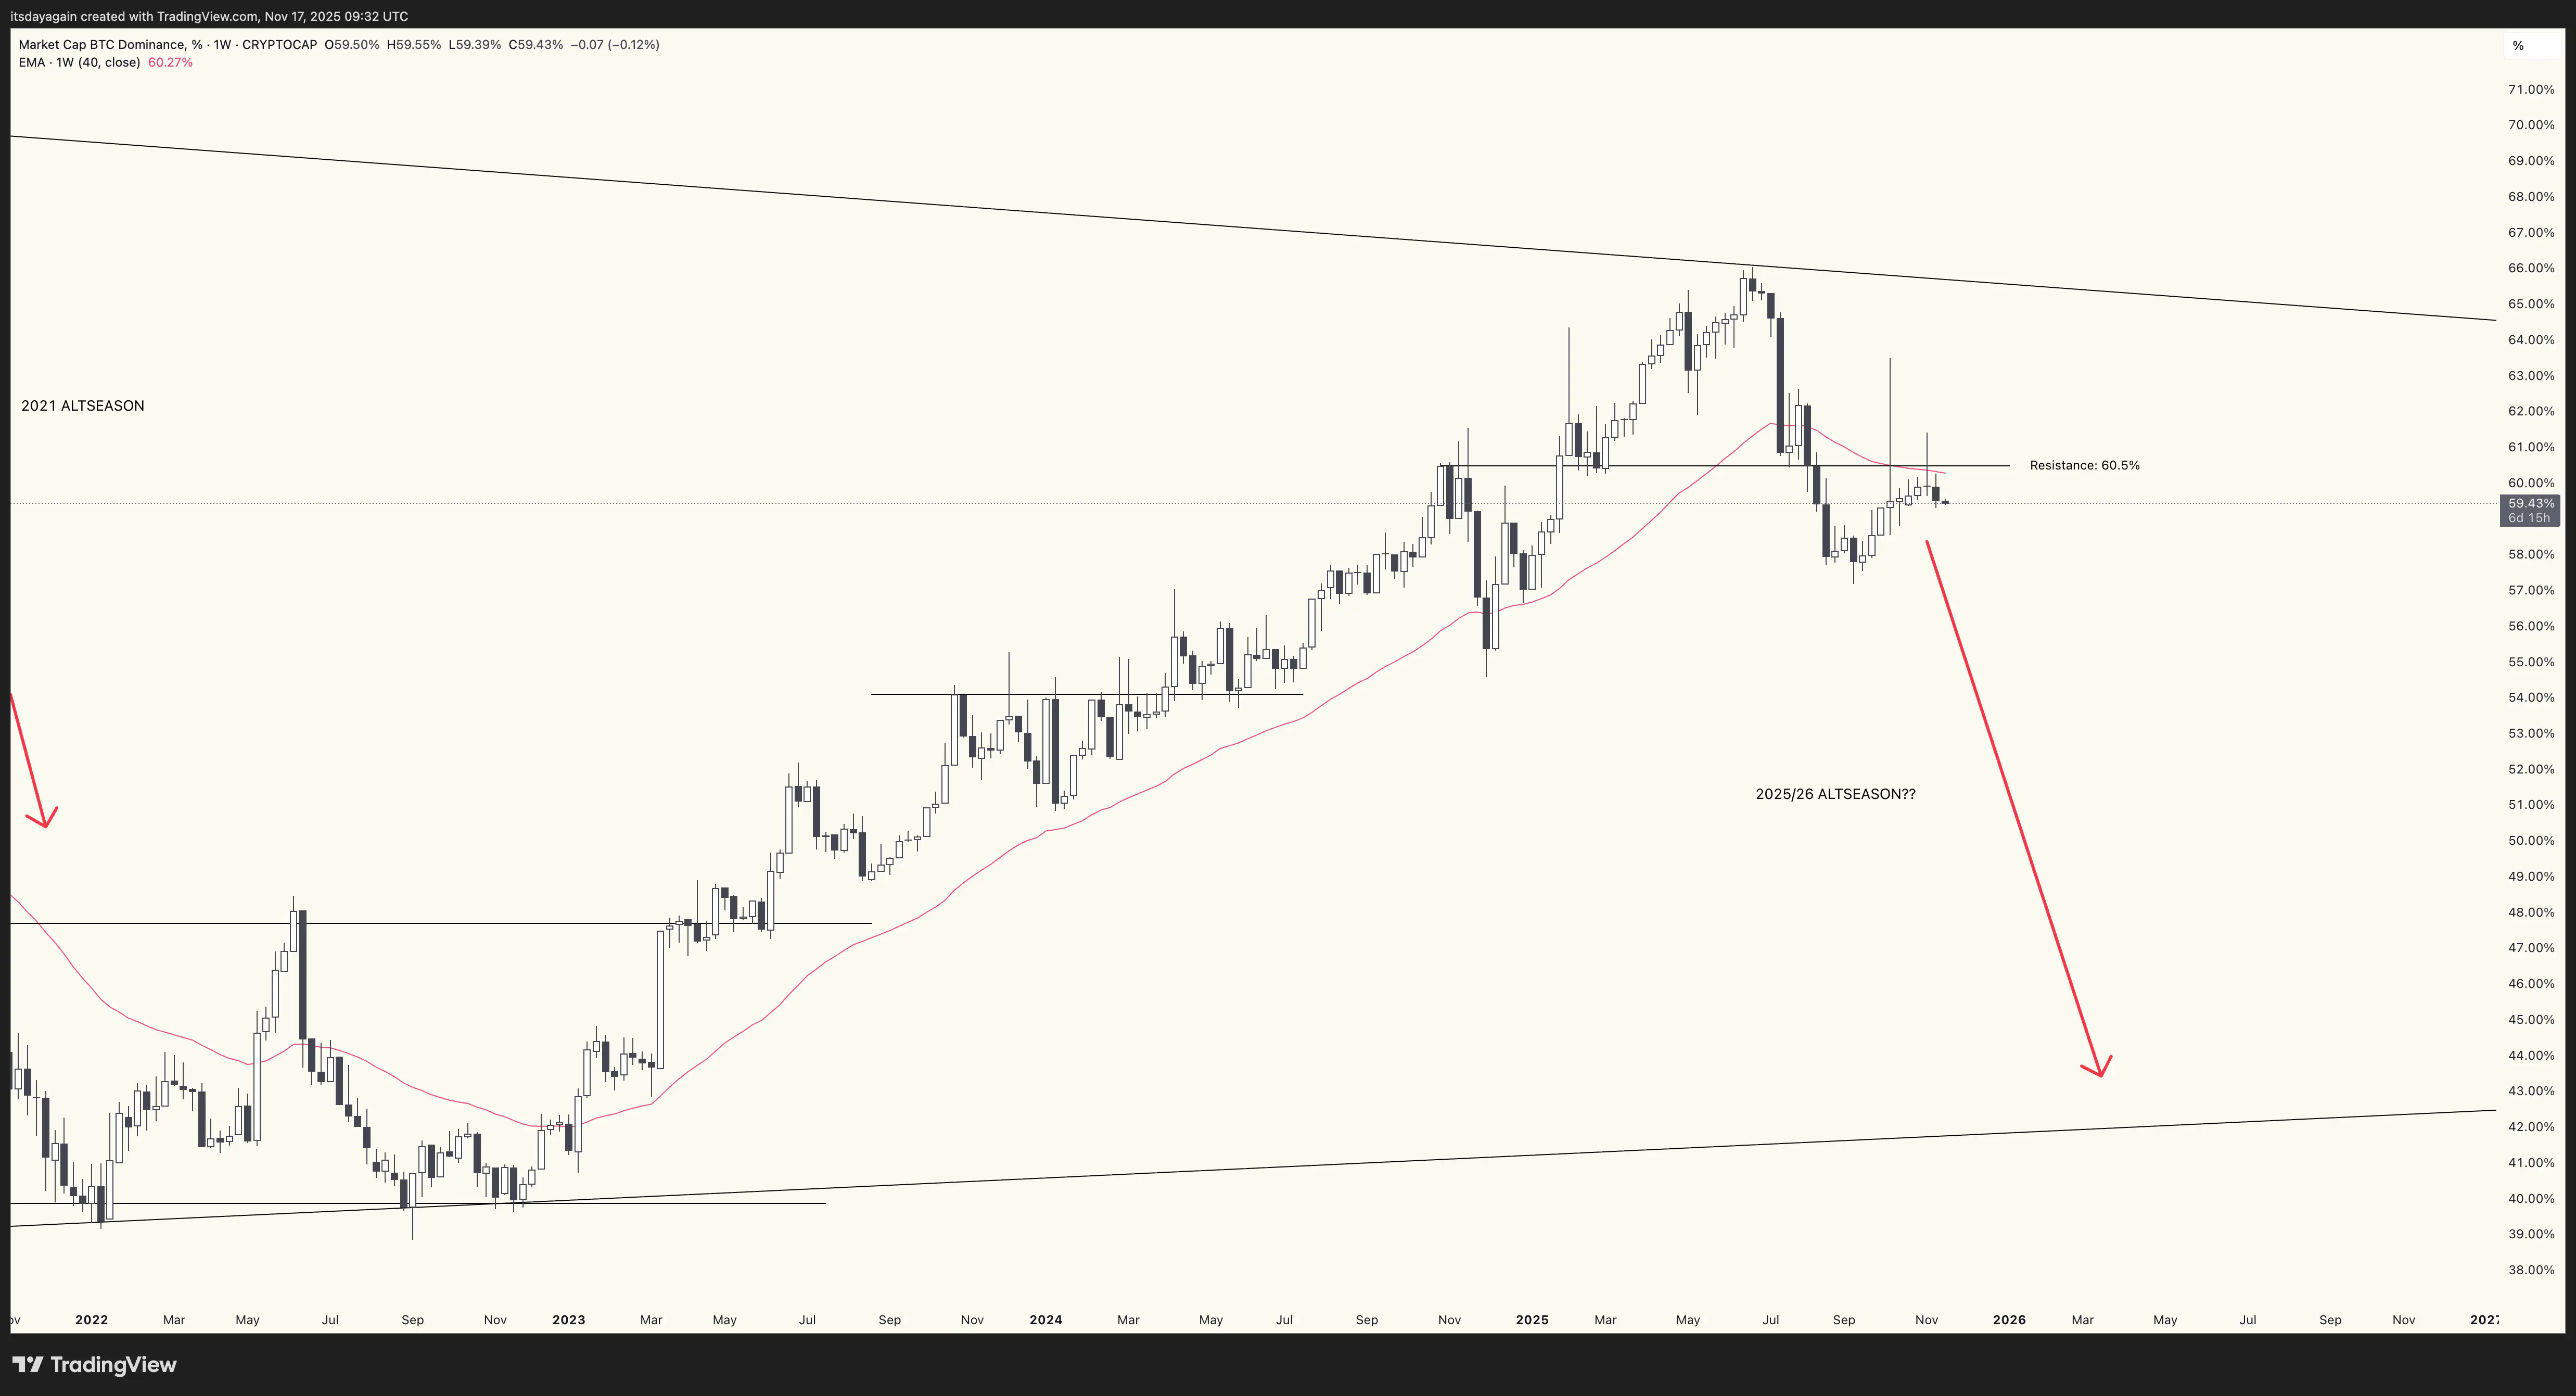
The one peculiar thing this week is that while crypto has been selling off, bitcoin dominance actually went down for the week. Meaning altcoins have on average been stronger than bitcoin. It’s still too early to draw any conclusions from this, however.