Bitcoin weekly: Can the Russell 2000 save us?
Stock markets are strong all across the world. In the US, the smallcap Russell 2000 index might be breaking out on the monthly chart. The past three times this happened, it was very good for crypto. And bitcoin is indeed showing some strength on the daily chart. But in the bigger picture, there are no clear signs of a bottom being in just yet.
Also watch the accompanying chart analysis on YouTube.
This past week saw new all time highs in stock markets all around the world. This is good: as long as stocks go up, there is still room for crypto to continue the relief rally after the breakdown in November.
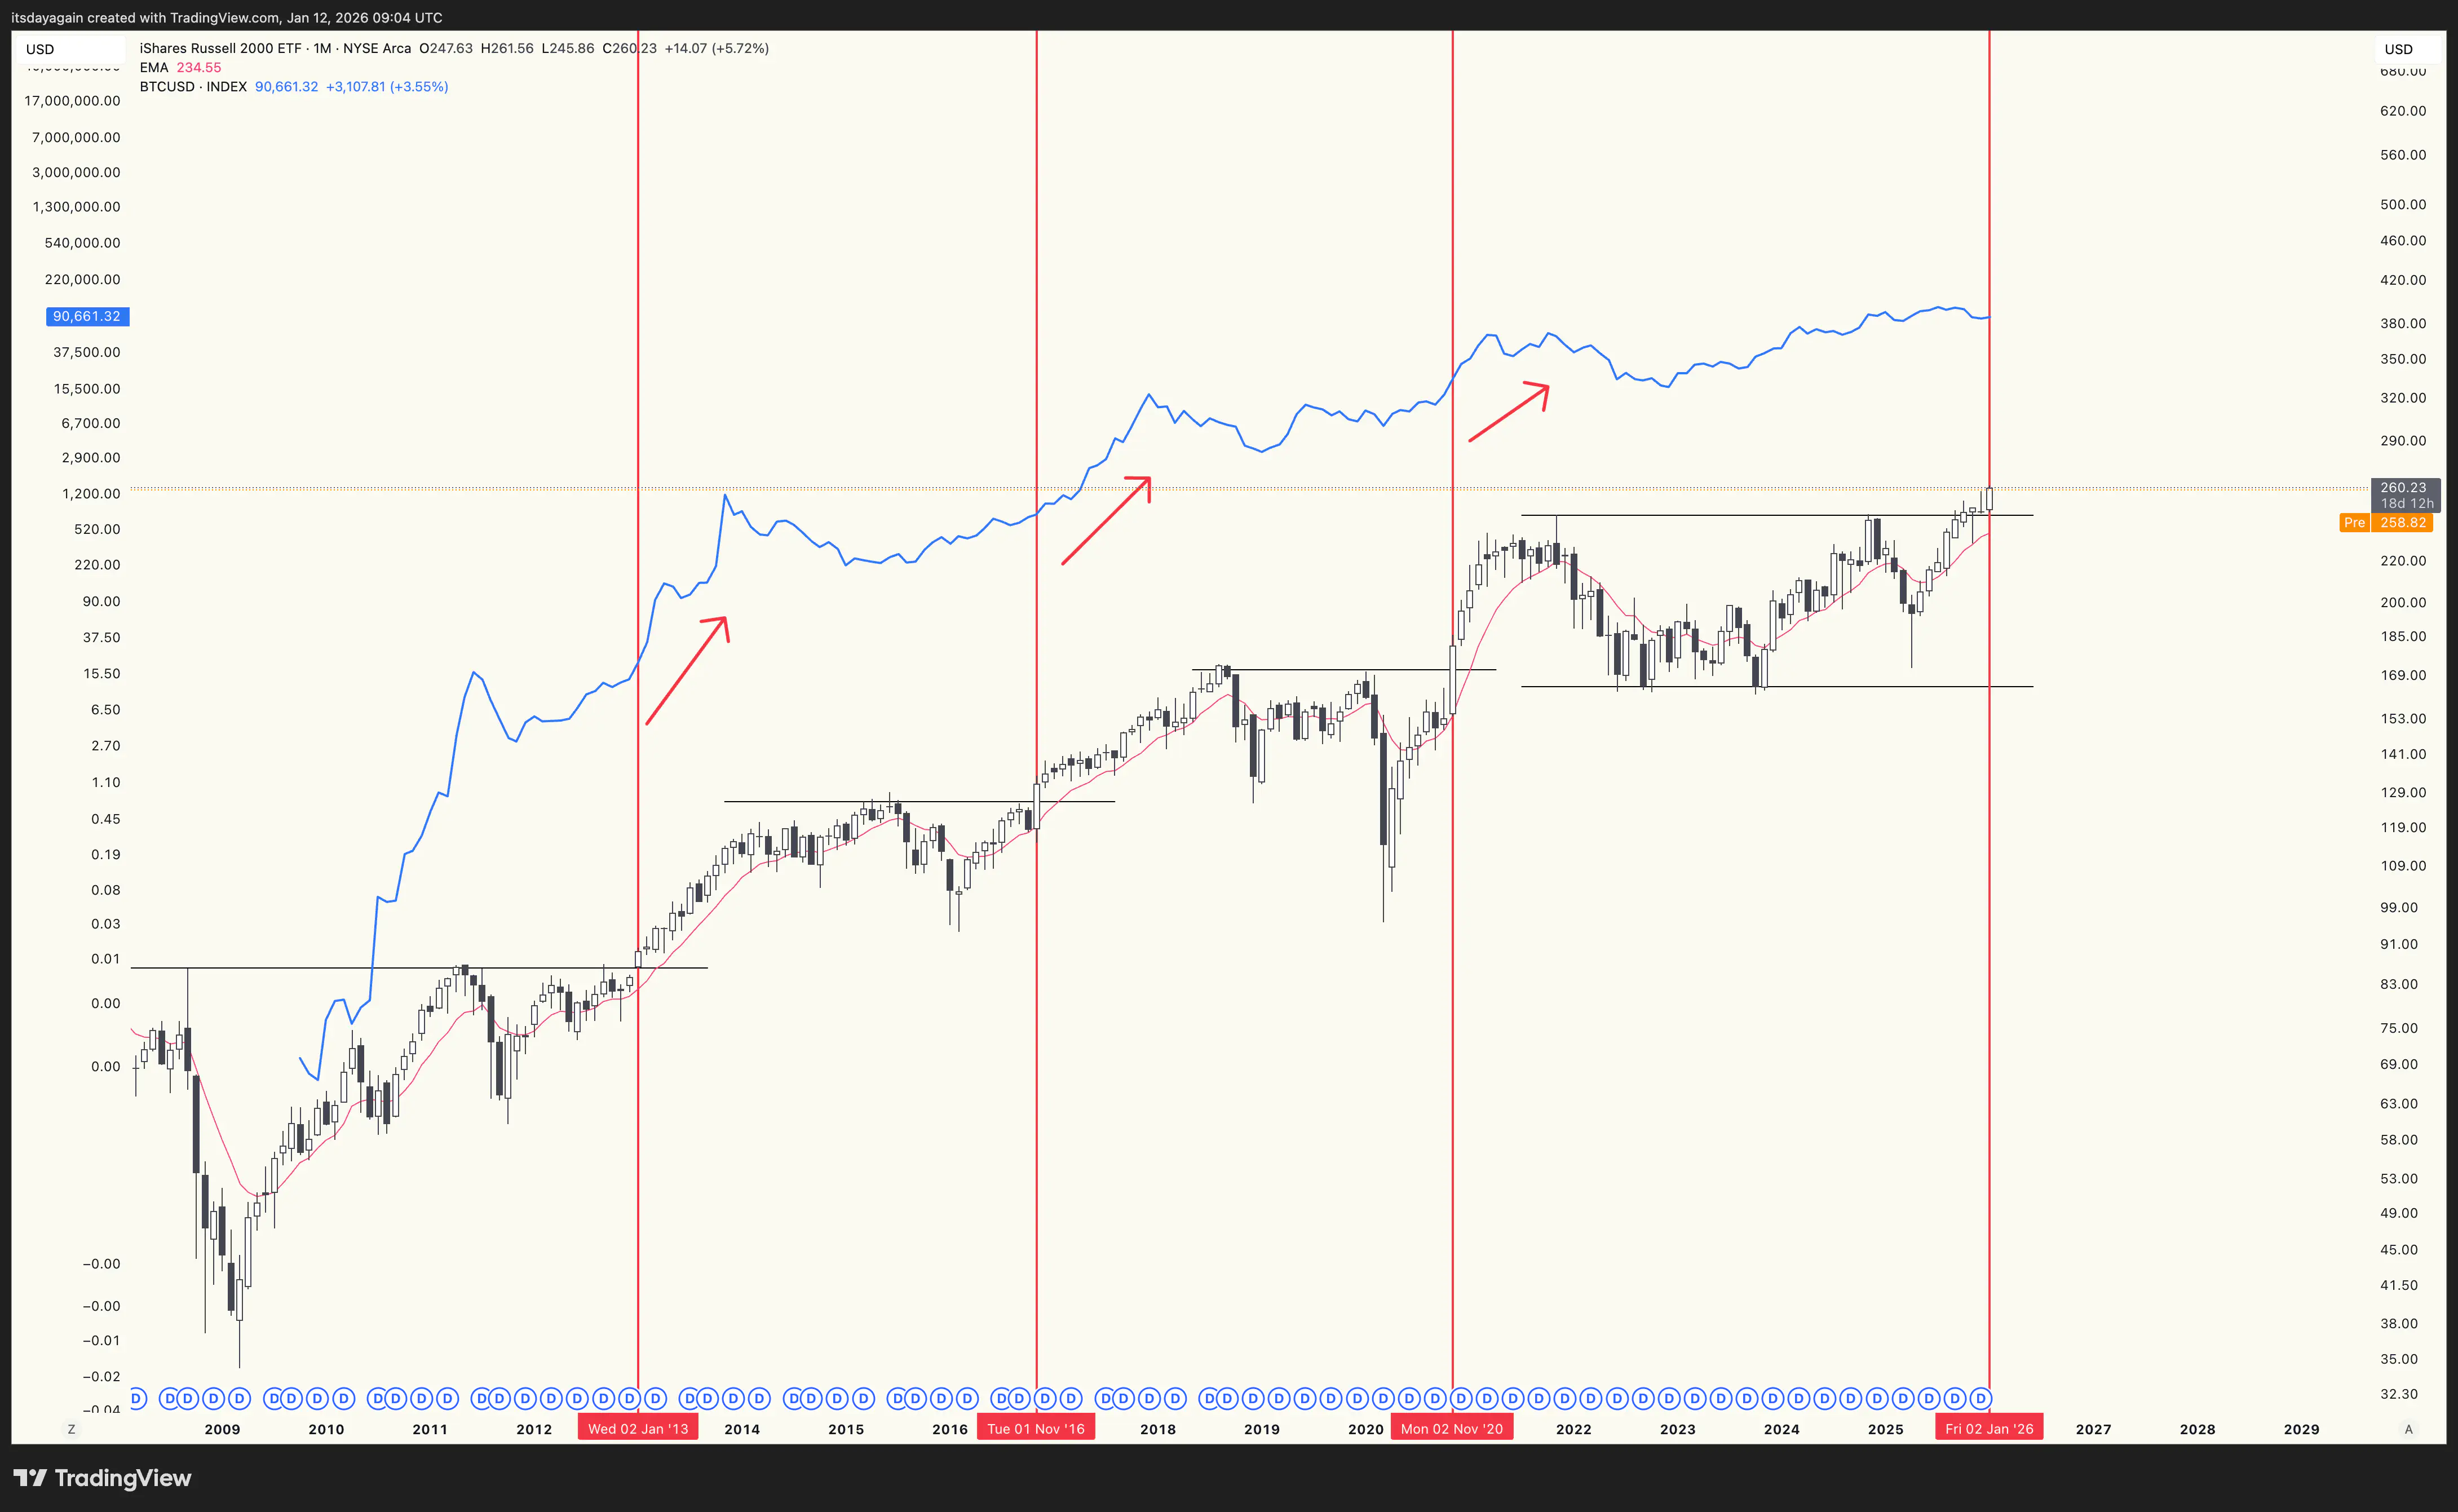
In the US, the Russell 2000 index might be breaking out on the monthly scale. This index of smallcap stocks has been a good indicator for the crypto market in the past. Since the birth of Bitcoin in 2009, the Russell 2000 has broken out to new all time highs on the monthly chart exactly three times: in 2013, 2016, and 2020. And each time that happened, crypto did extremely well after the breakout. (See chart below.)
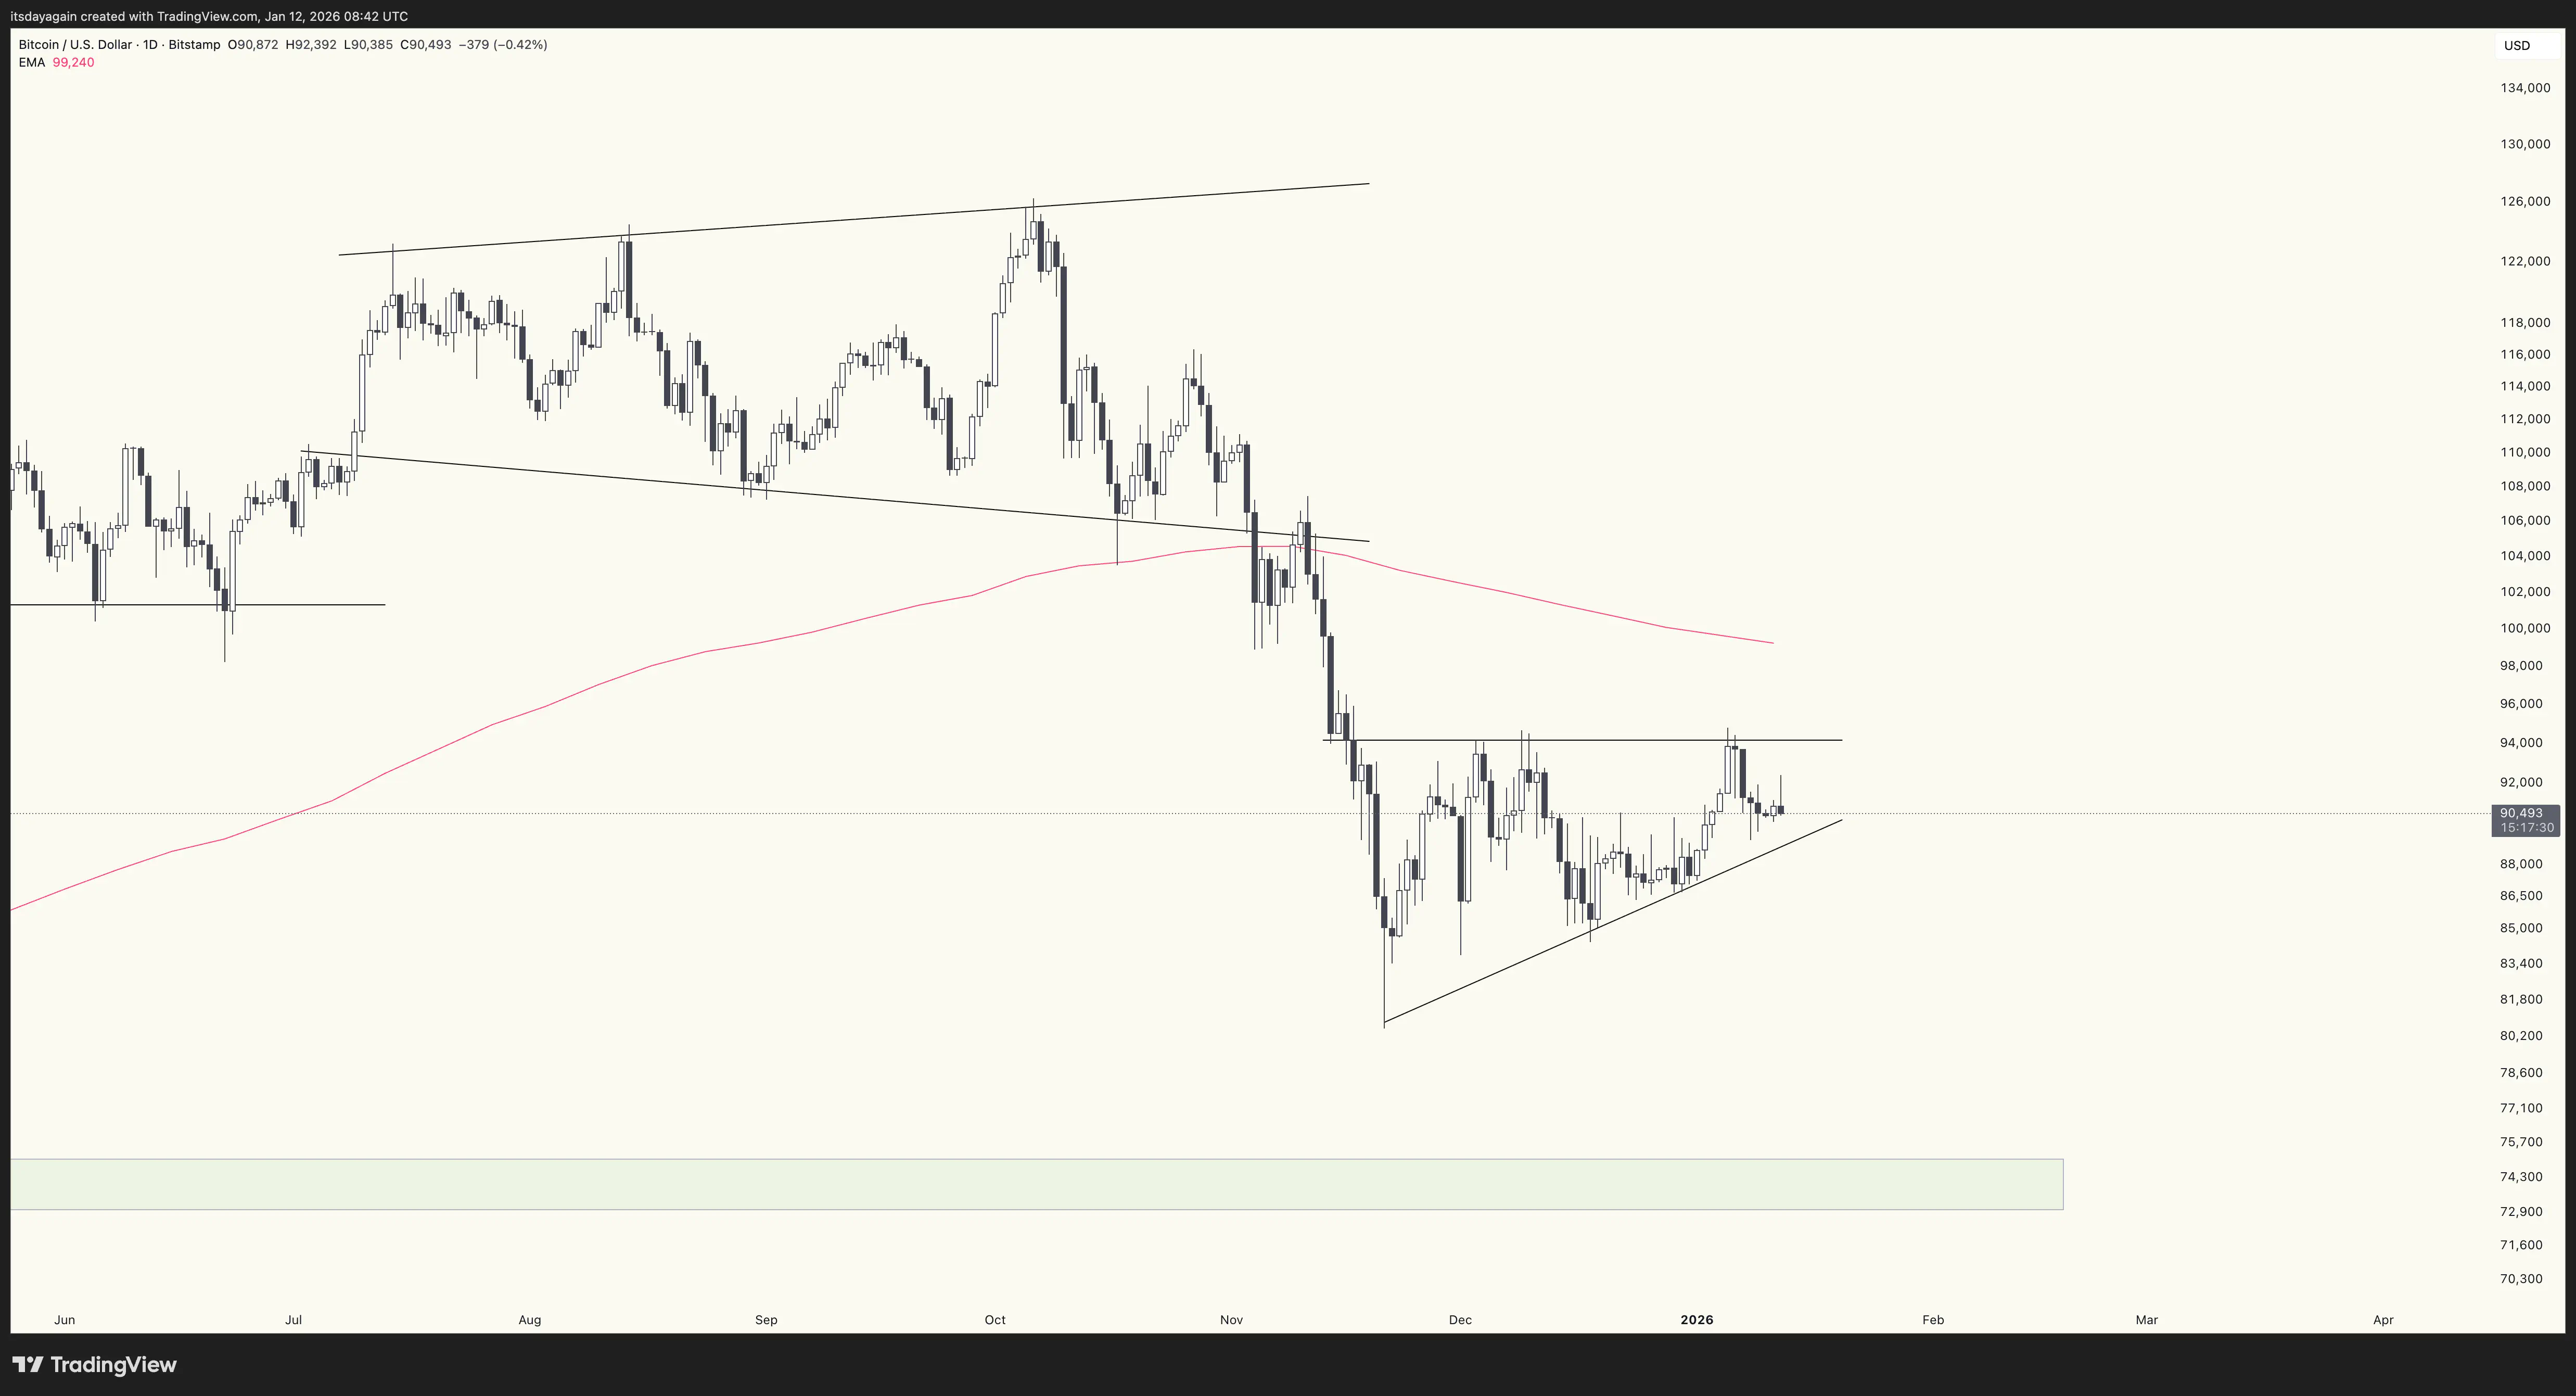
Looking to the daily bitcoin chart, there are some signs of strength. A small ascending triangle could be forming, with the upper resistance at 94k. The higher lows making up the bottom of an ascending triangle makes it a fundamentally bullish pattern. But it must still break out above 94k to confirm. If that happens, the relief rally can continue in the weeks ahead. (See chart below.)
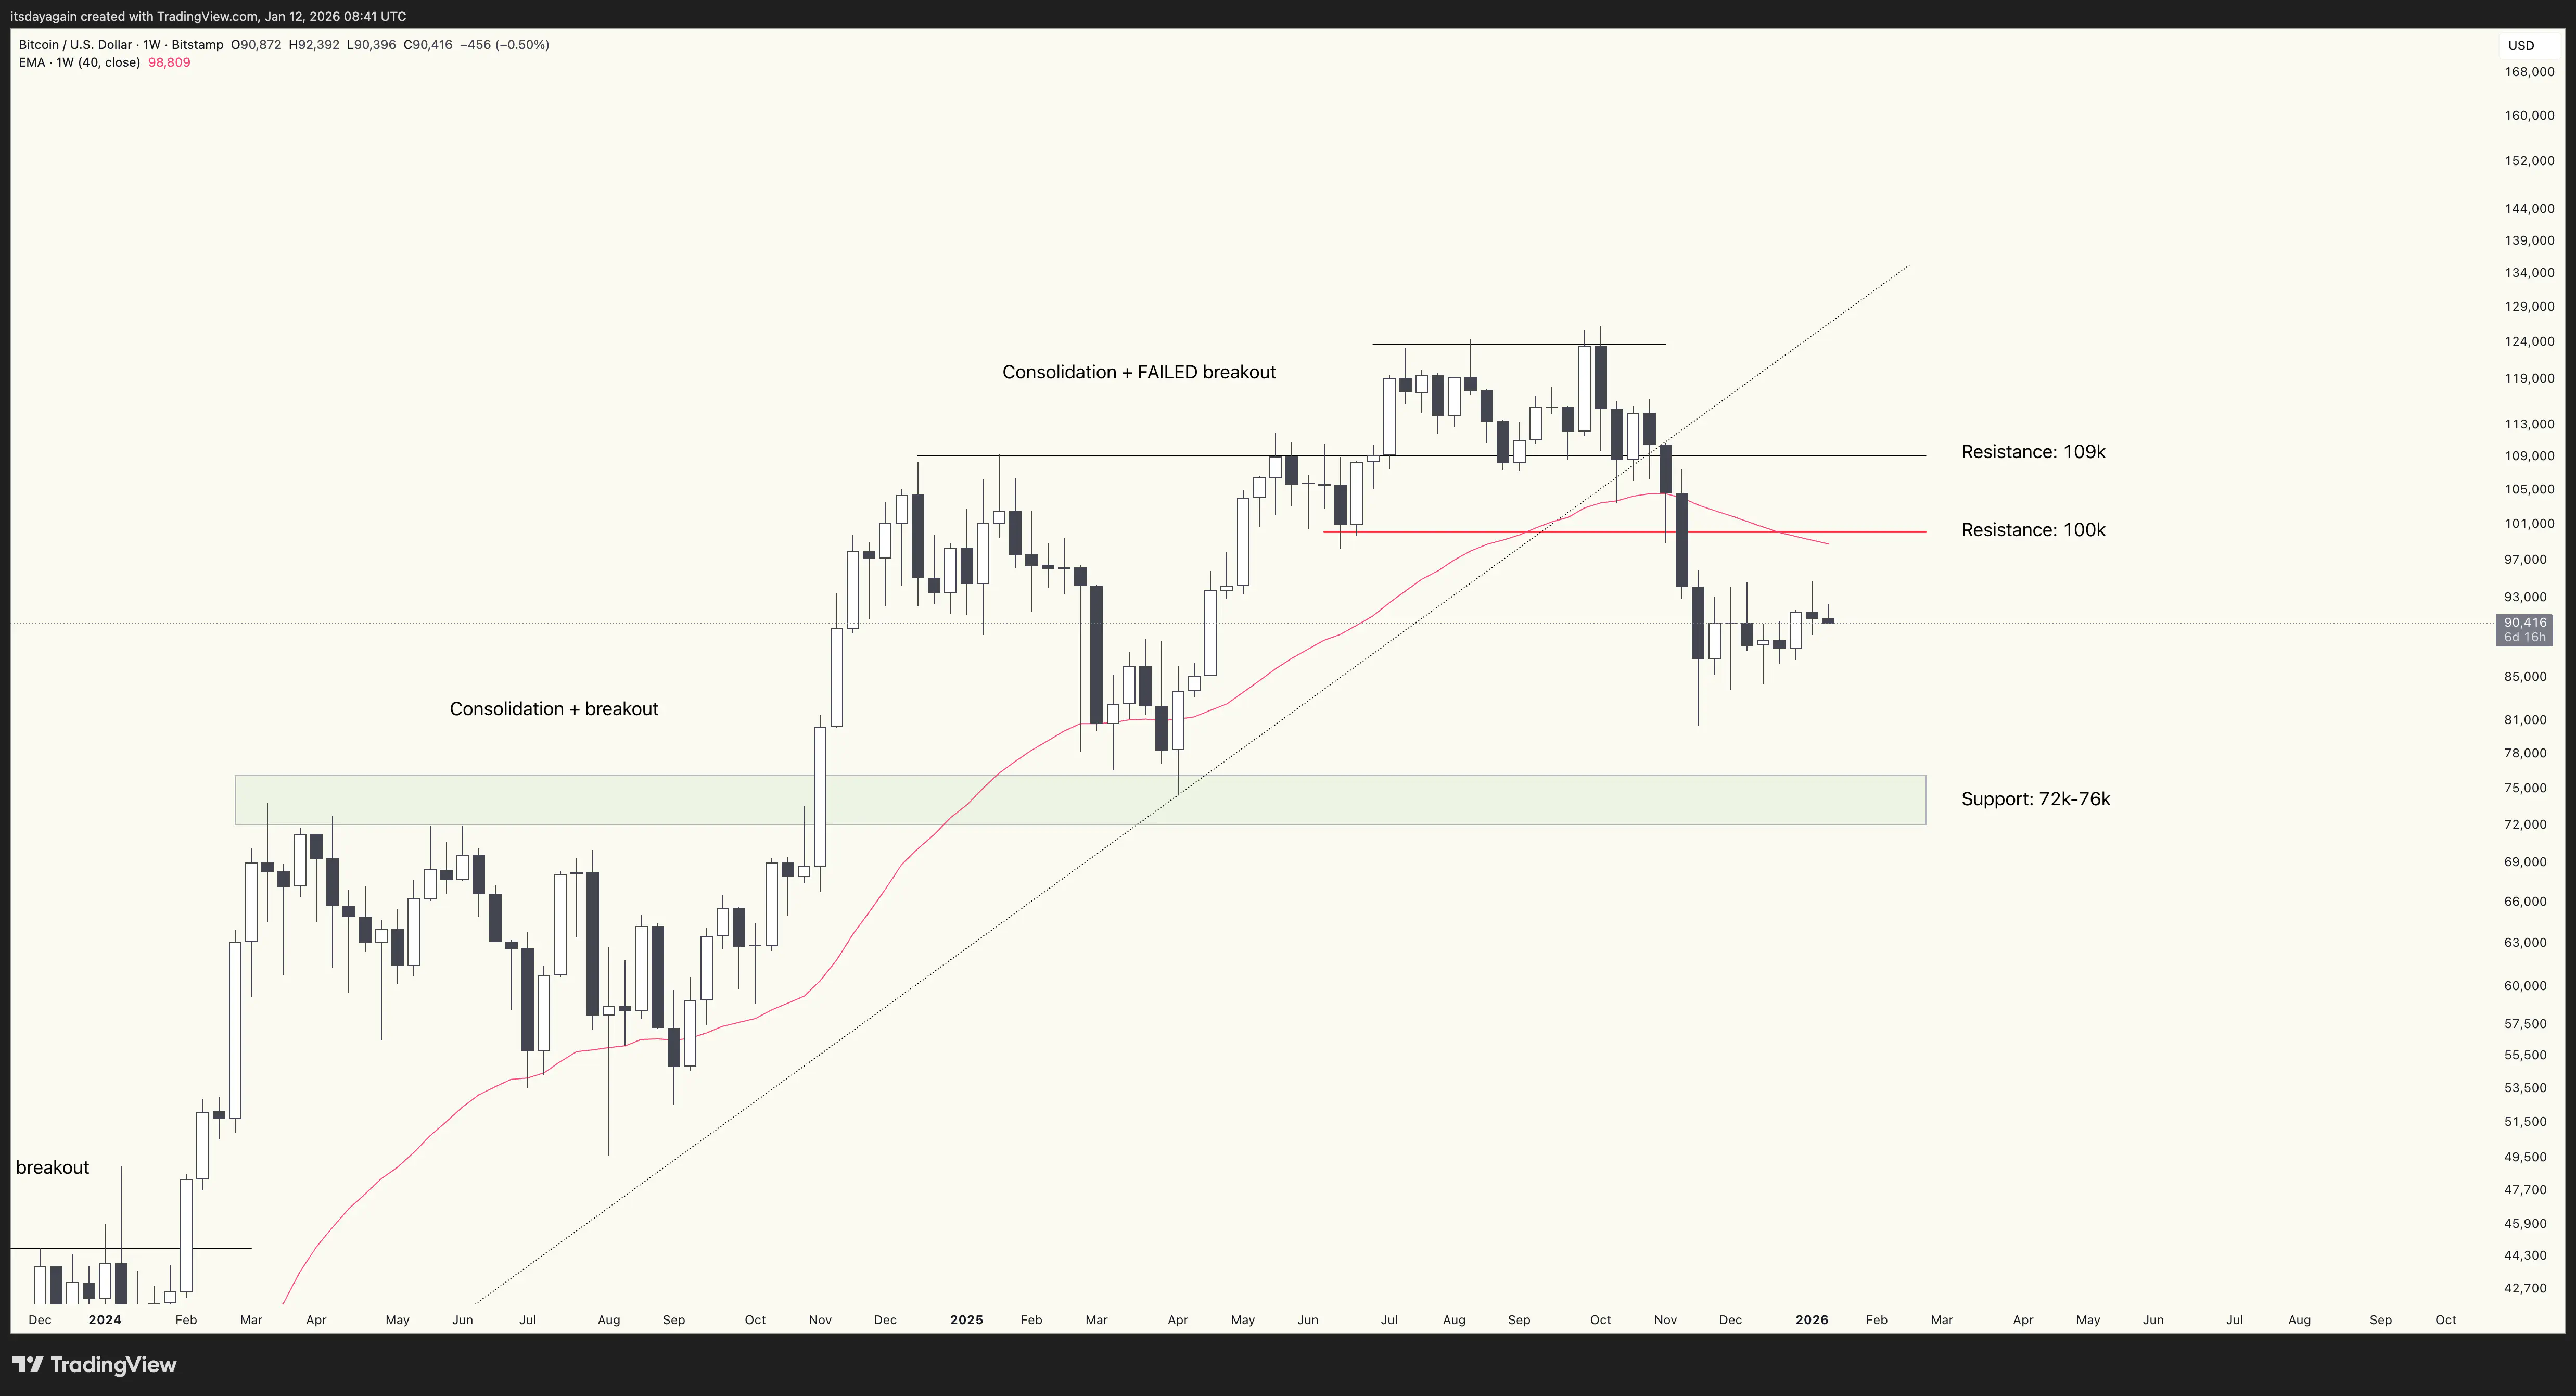
Zooming out to the weekly bitcoin chart, we see that nothing has changed since the breakdown in mid November. After the breakdown, it went down to a low point right above 80k, and since then it’s been bouncing. There are no signs here of a bottom being in yet, and we should expect heavy technical resistance at 100k and 109k. If it eventually turns around back down, which is still the base case, it can find support at 72k-76k. (See chart below.)