Bitcoin Weekly: Trade the Chart, Not the Narrative
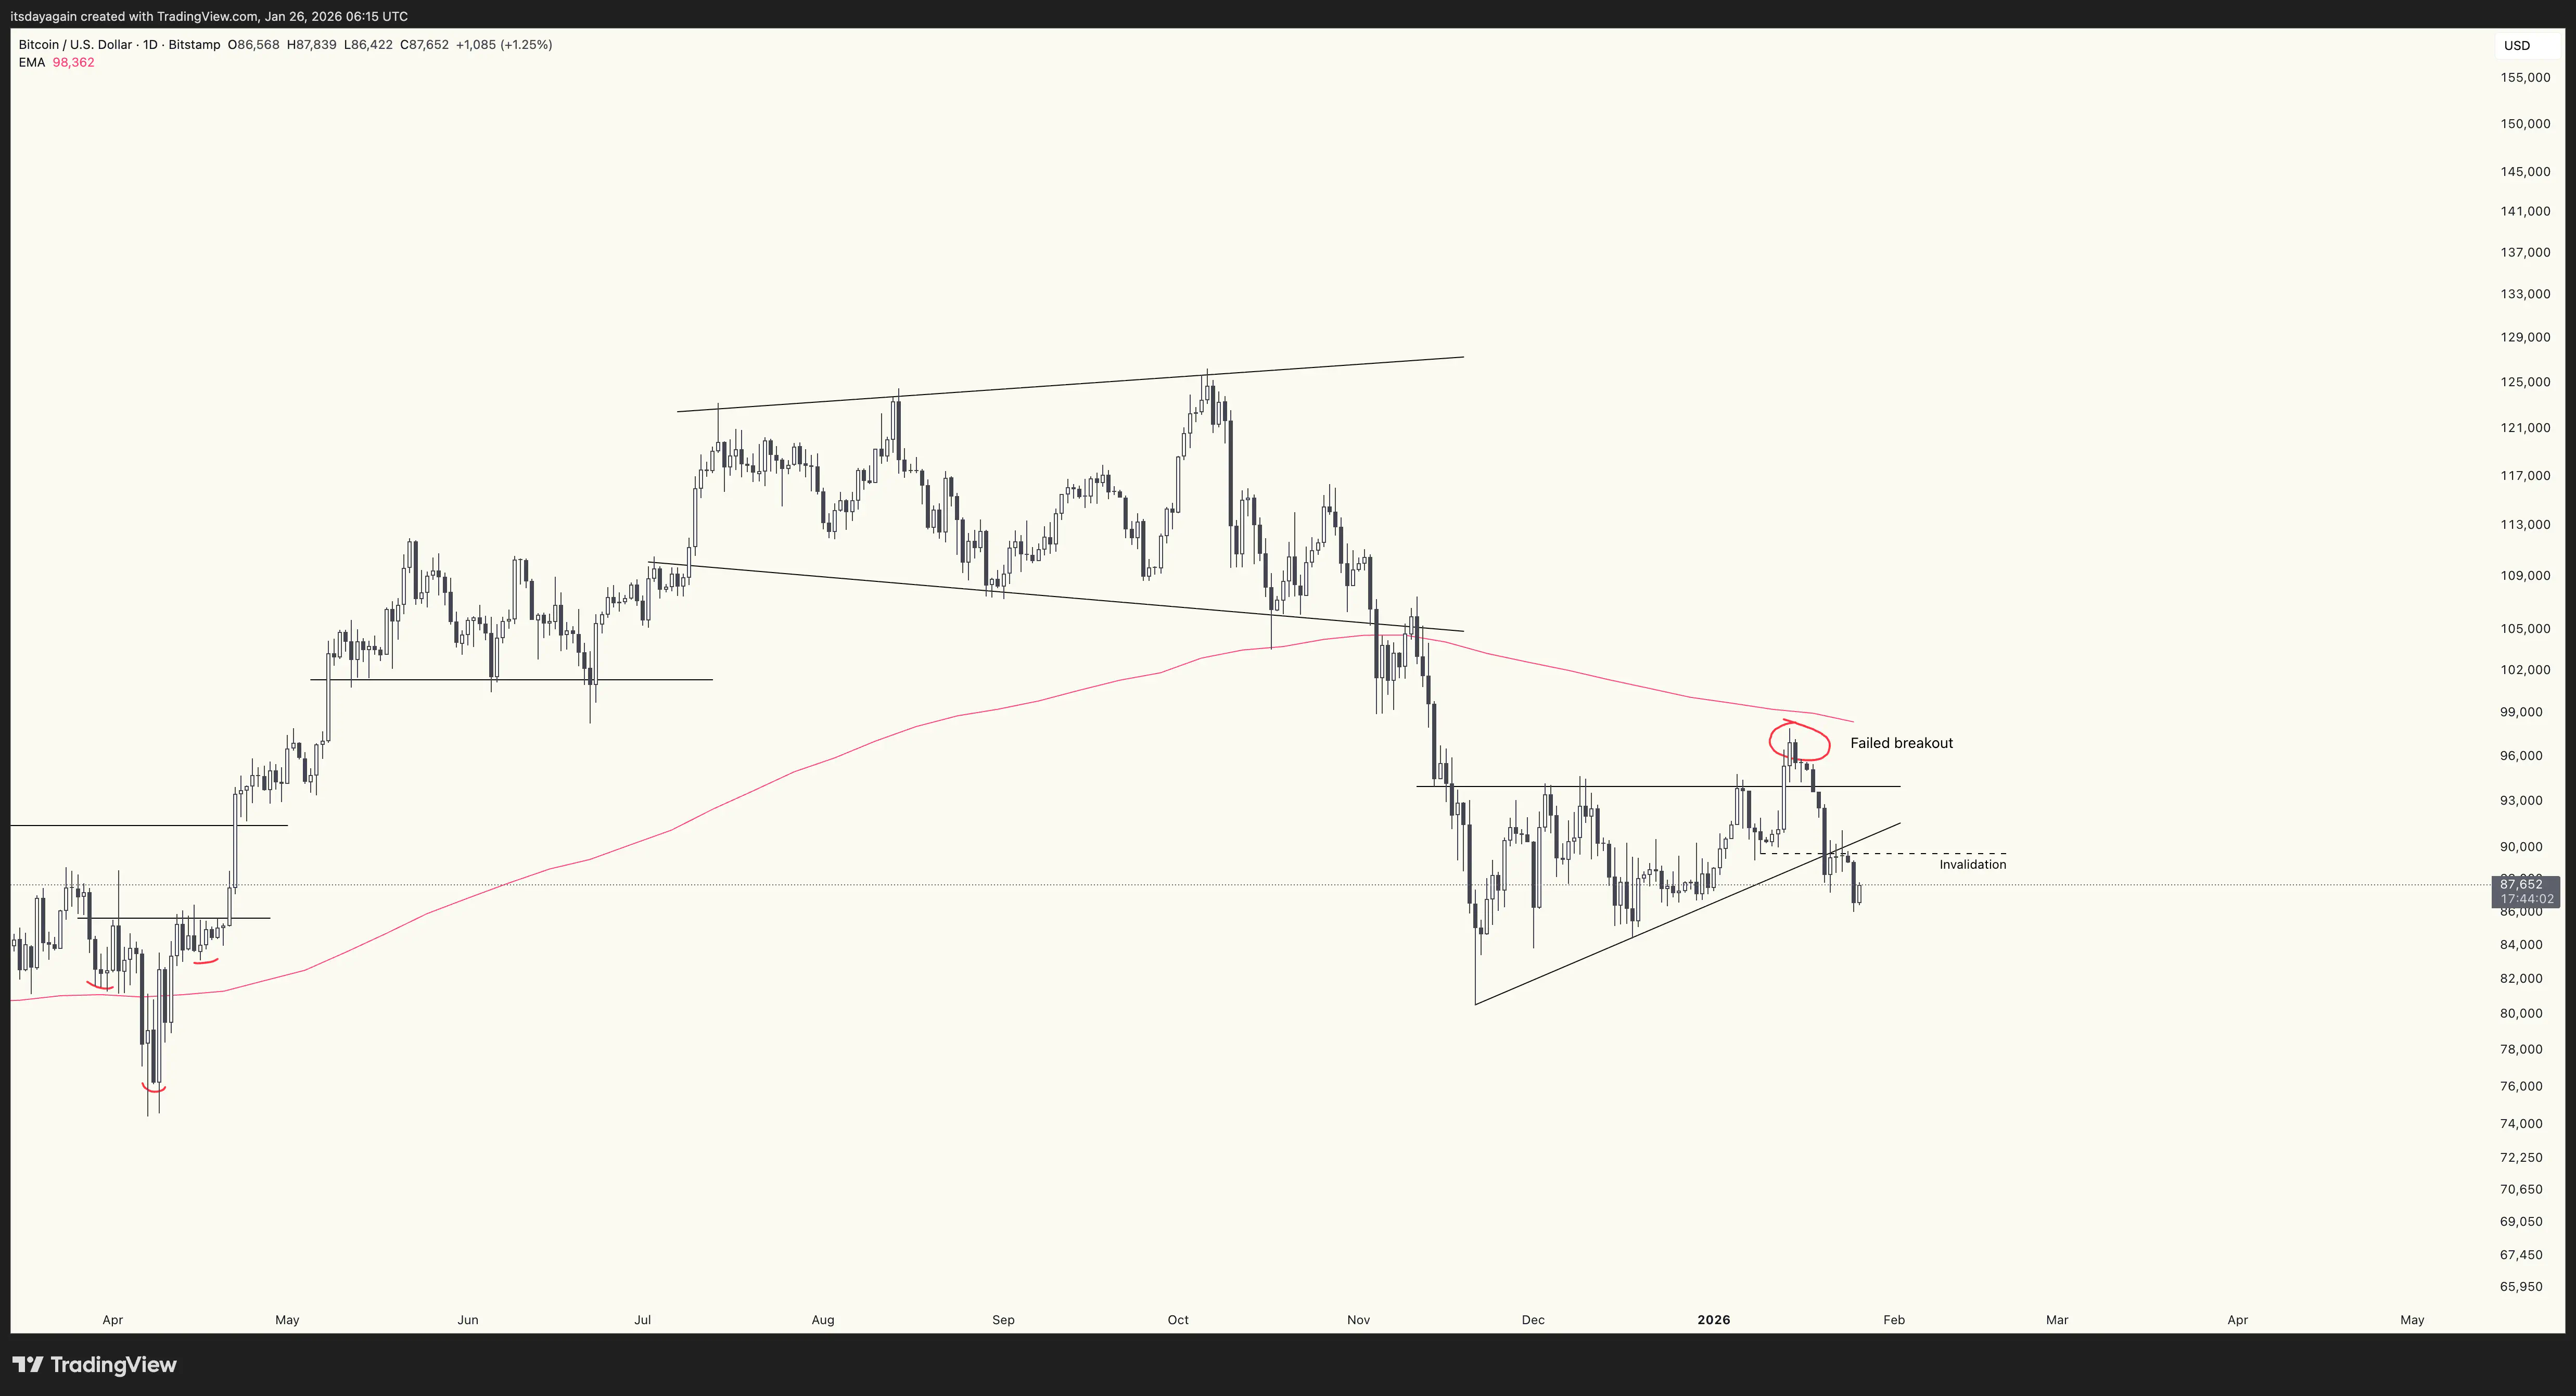
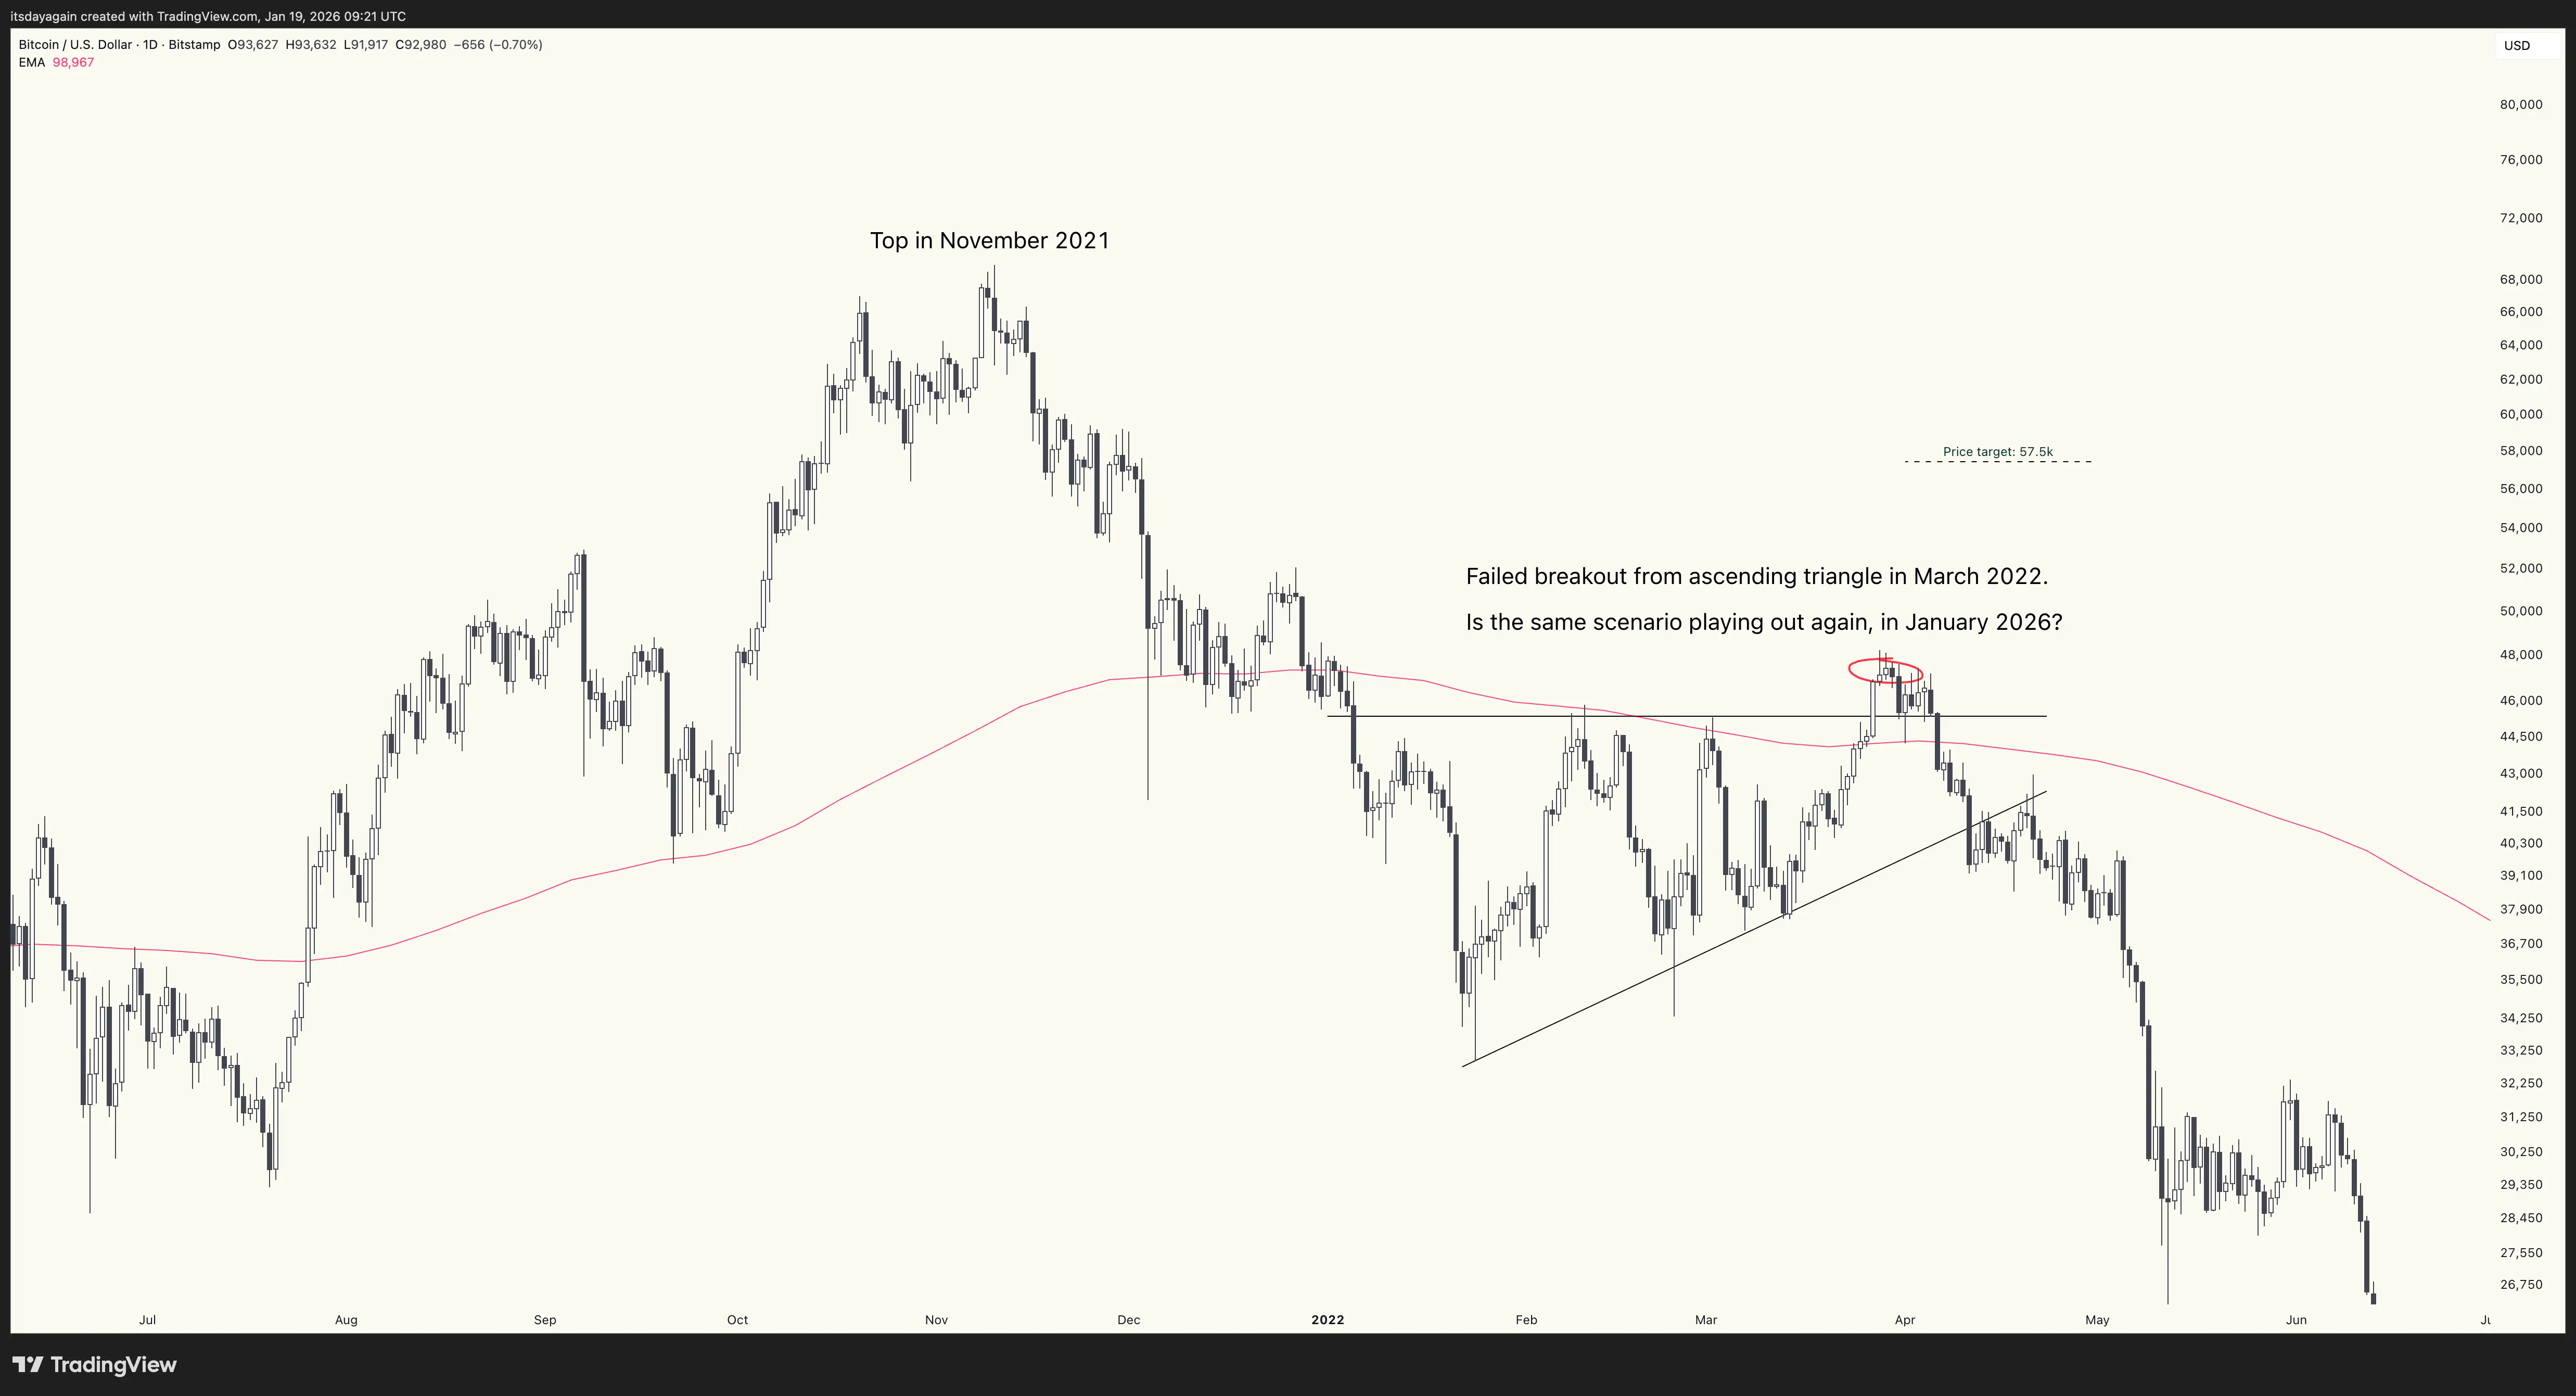
While silver and gold are rallying, Bitcoin is clearly not living up to its promise as a risk-off inflation hedge. Last week I wrote about how similar the bitcoin chart is now, compared to how it played out after the top in 2021. This week the similarity continues: the ascending triangle has failed, showing more weakness.
Also watch the accompanying chart analysis on YouTube.
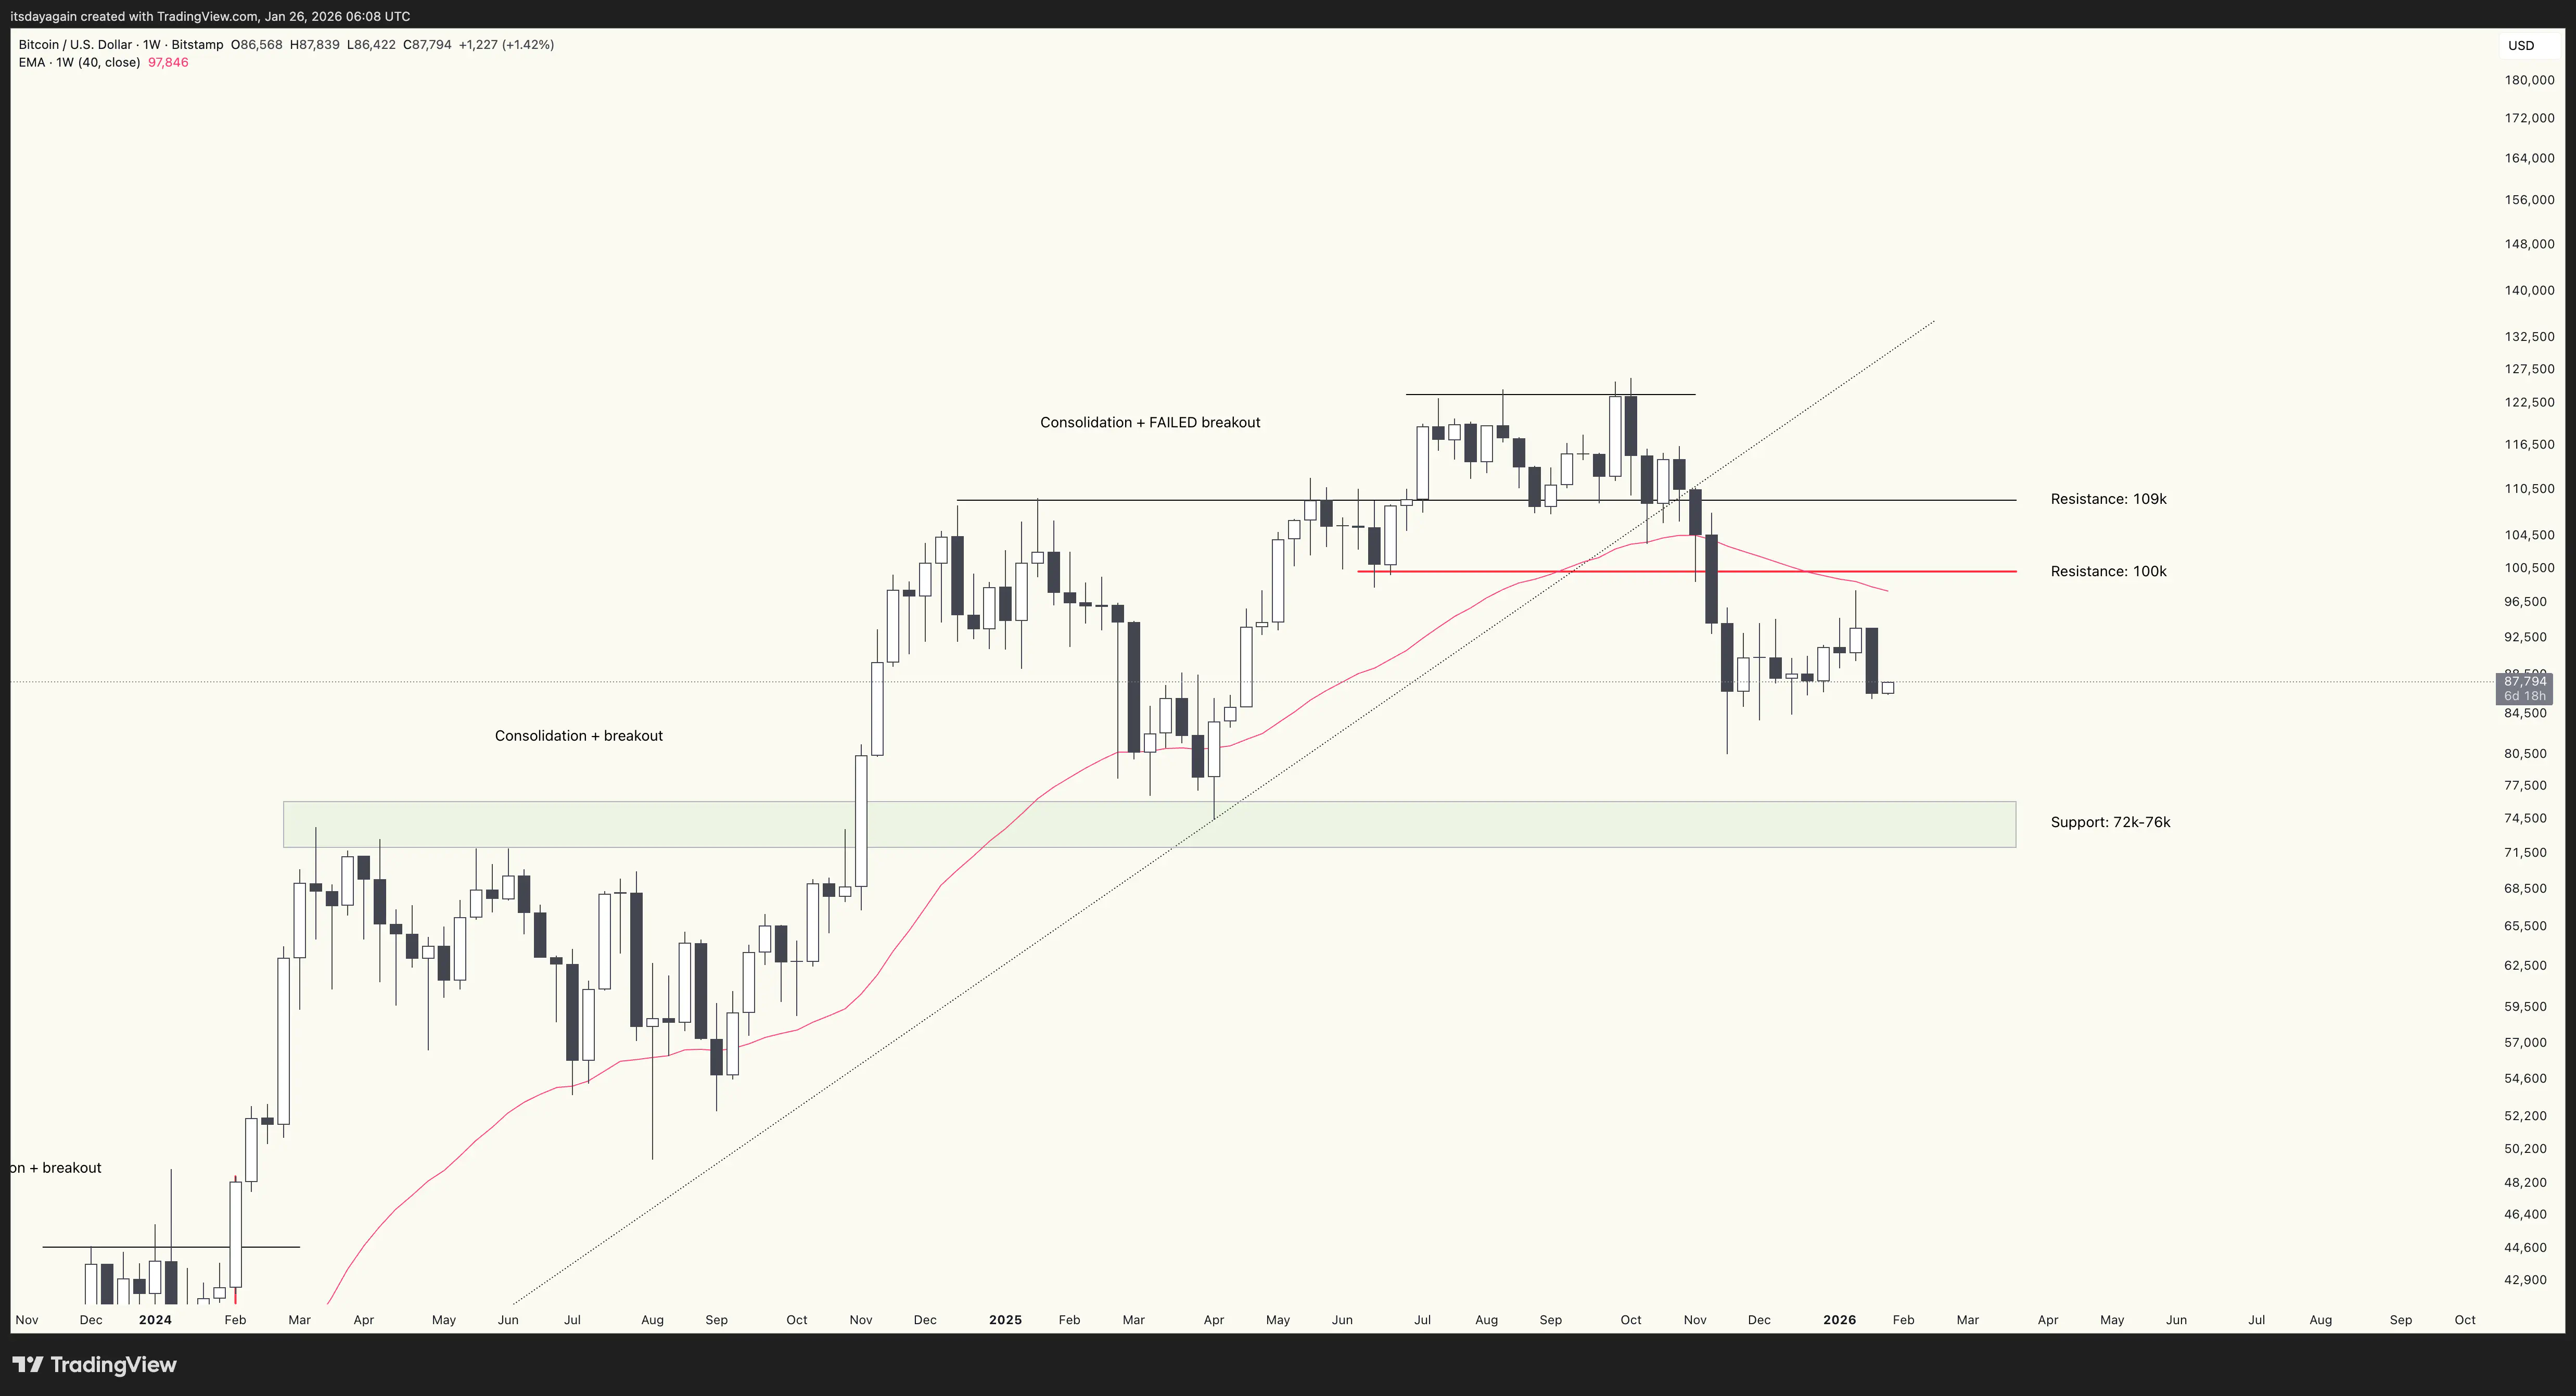
Let’s have a quick look at the weekly chart first, which is still consolidating after the breakdown in November. It now looks increasingly likely that 98k was the top of the bounce, and a lower low is coming up next. This has been the base case all along since the breakdown. Major technical support is at 72-76k, so that’s the logical place to watch for a lower low.
Meanwhile, gold and silver are both doing extremely well, as the traditional safe-haven assets. For a long time that has been the narrative for bitcoin as well: “it’s digital gold, a safe store of value, a hedge against inflation.” But the reality is clear here: that narrative was make-belief, or at least it was premature. Because clearly bitcoin is NOT acting like digital gold right now.
This is why you should always trade the charts, not the narrative.
Zooming in to the daily chart, the ascending triangle that faked out to the upside two weeks ago has now been invalidated. The pattern is morphing into something else. Possibly a wedge, which is a bearish pattern.
Compare this again to the daily chart from after the top in 2021, which we had a look at last week. The comparison is now even more similar. If this scenario keeps playing out, we could expect some consolidation in this area, followed by a continuation down to a lower low, perhaps around the 75k level suggested by the weekly chart.
Stay cautious.