Bitcoin Weekly: Inverted Hammer Let's Go
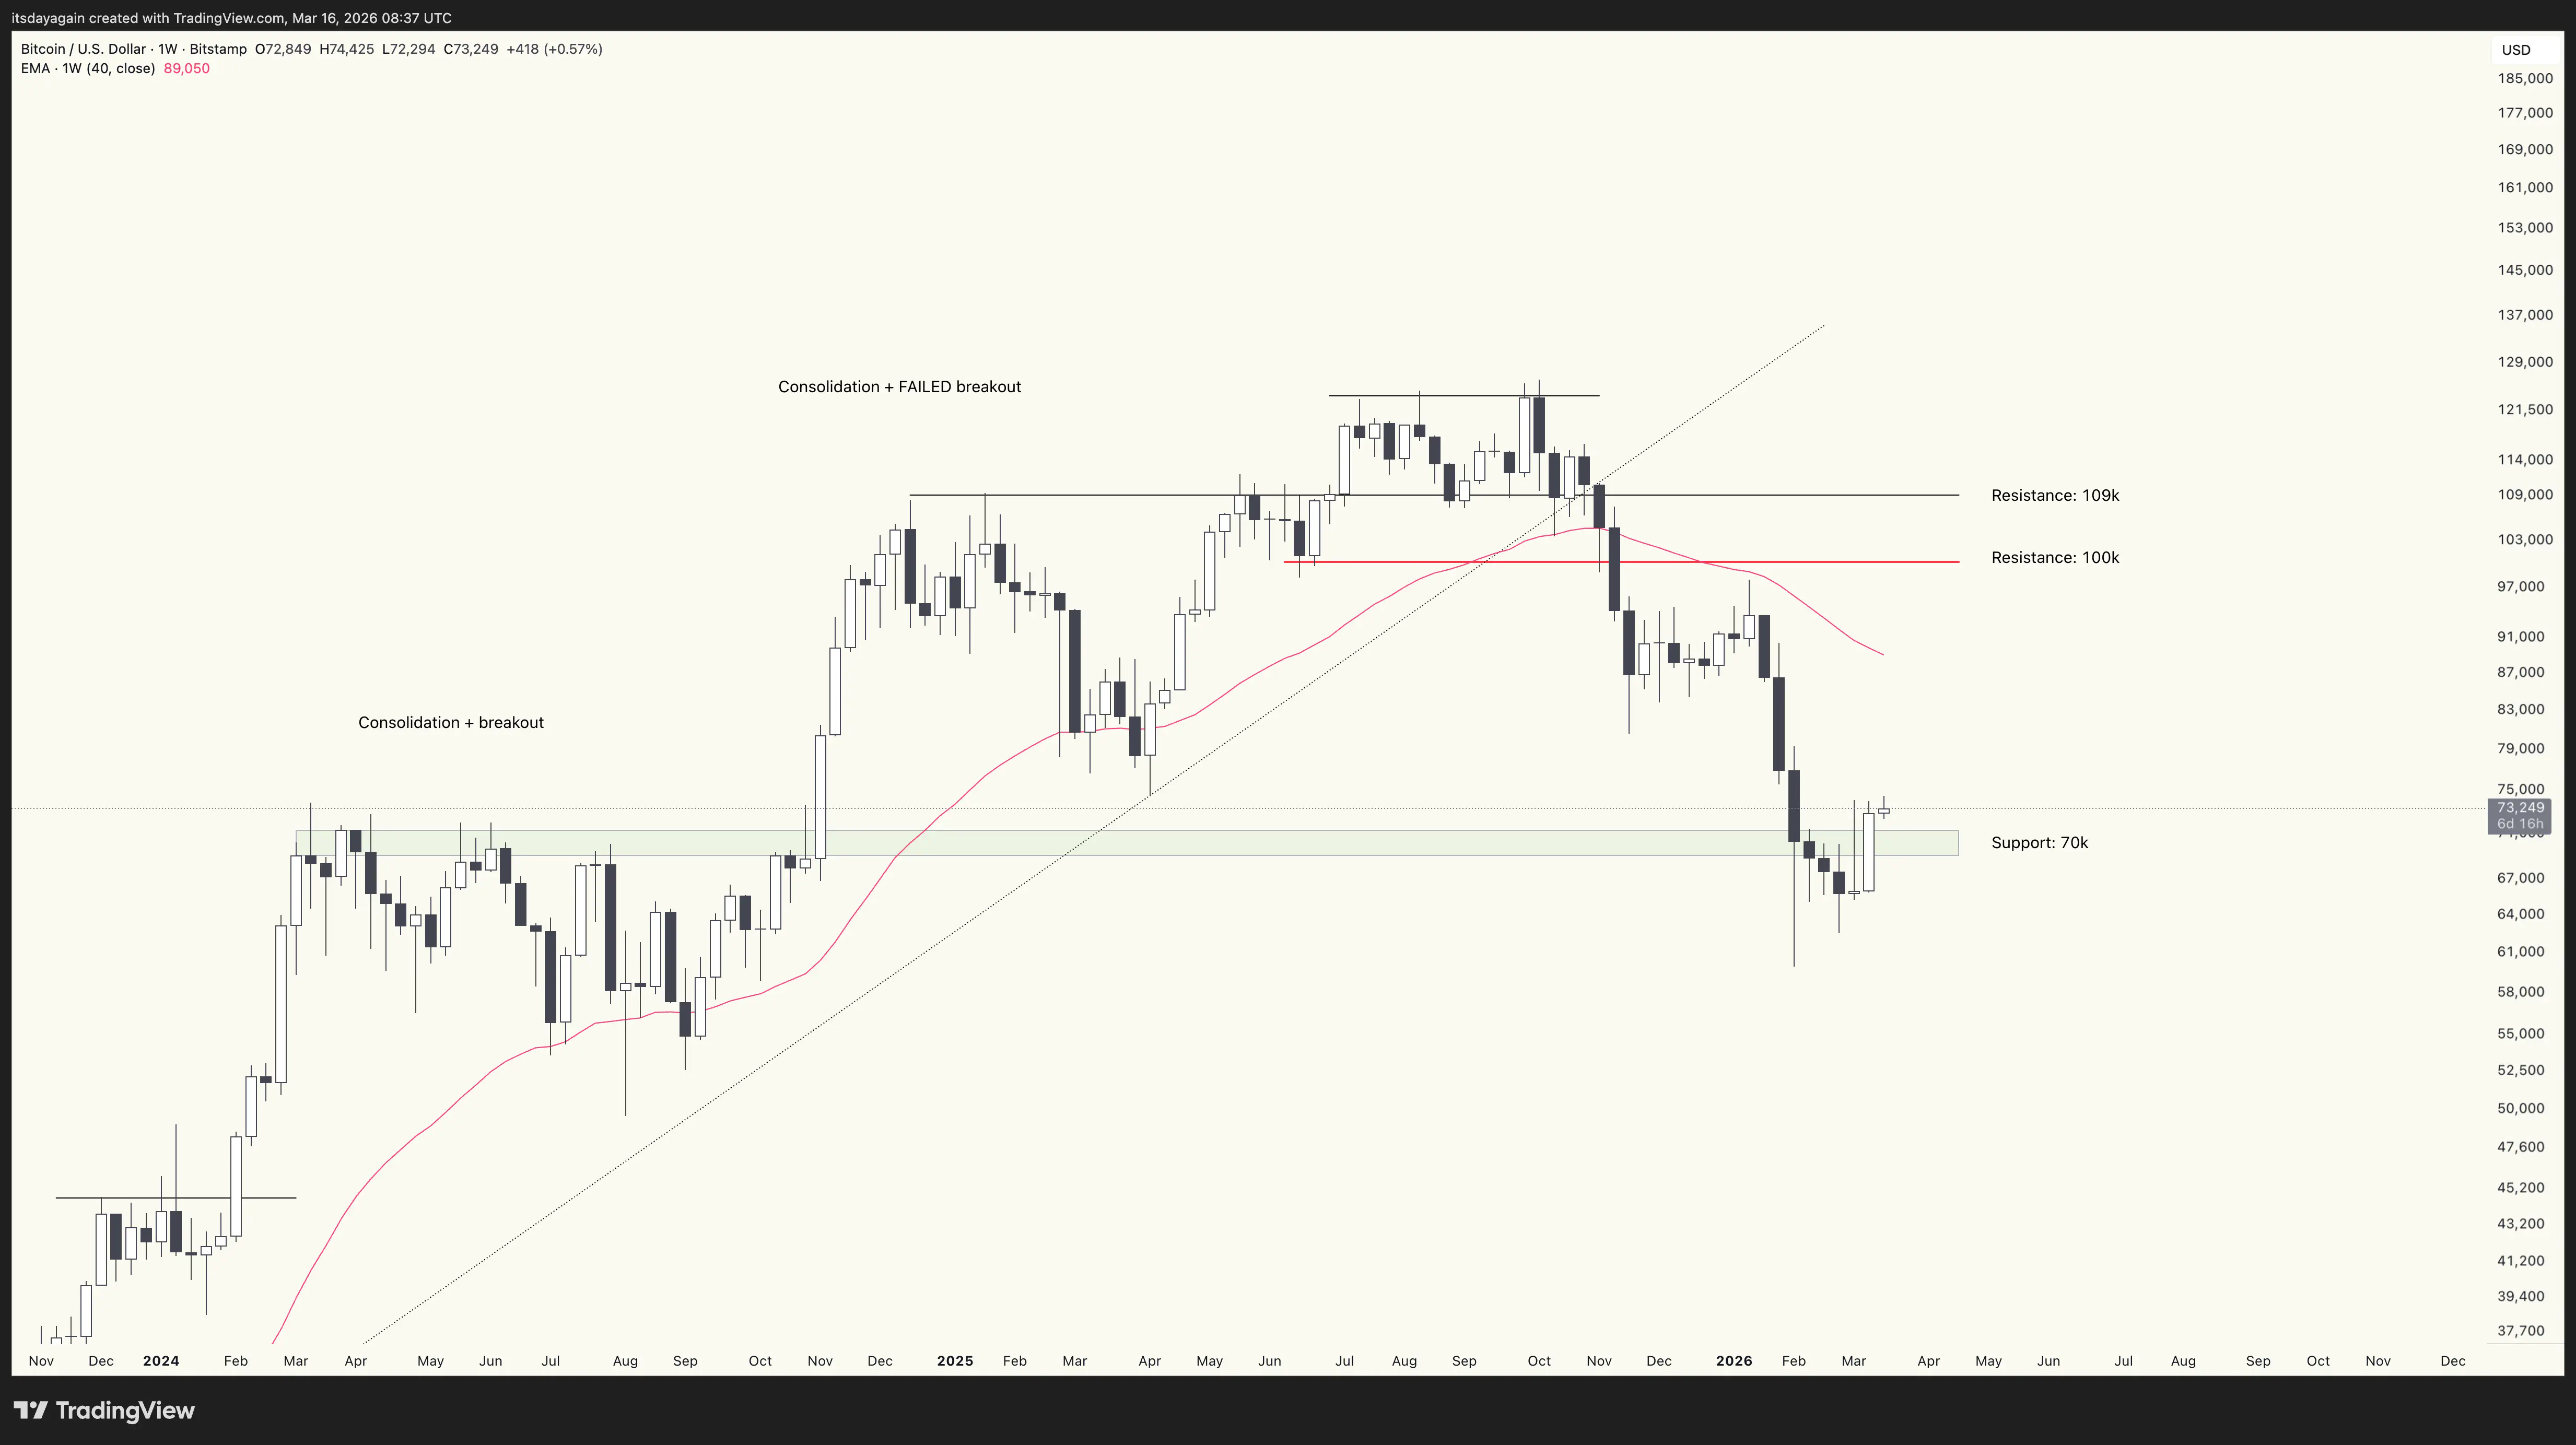
While US stock markets are struggling, coming down to test their 200 day moving averages, bitcoin actually showed strength last week, closing the week above 70k support. The bear market rally scenario is still on.
Five weeks ago, after the drop down to 60k, I laid out three possible scenarios:
- The bottom is in (unlikely).
- No bounce above 70k, straight down to a new lower low (less unlikely).
- Bear market rally over the coming months (likely).
So far, it seems like scenario number 3 is actually playing out. Despite weakness in the stock markets after the shitshow in the Middle East, bitcoin had a strong last week, closing at 72.8k. This reclaimed the support area around 70k and set up an inverted hammer reversal pattern.
This inverted hammer pattern I’m talking about is a candlestick pattern that consists of an inverted hammer candle, followed by a confirmation candle. It’s a sign of reversal, especially when found around a support area.
An inverted hammer is a candle with a small candle body and a small lower wick, sitting right at the bottom of a long upper wick. What does this type of candle mean? The short wick to the downside shows that sellers were not able to push the price down below the week’s open. The long wick to the upside shows that buyers started stepping in, although not enough to exhaust sellers.
An inverted hammer candle on its own is not enough to show strength. But when it’s followed by a strong next candle, it is. Why is that? Because the strong followup candle shows that buyers are still stepping in, now overwhelming the sellers, allowing the price to rise into a strong candle close.
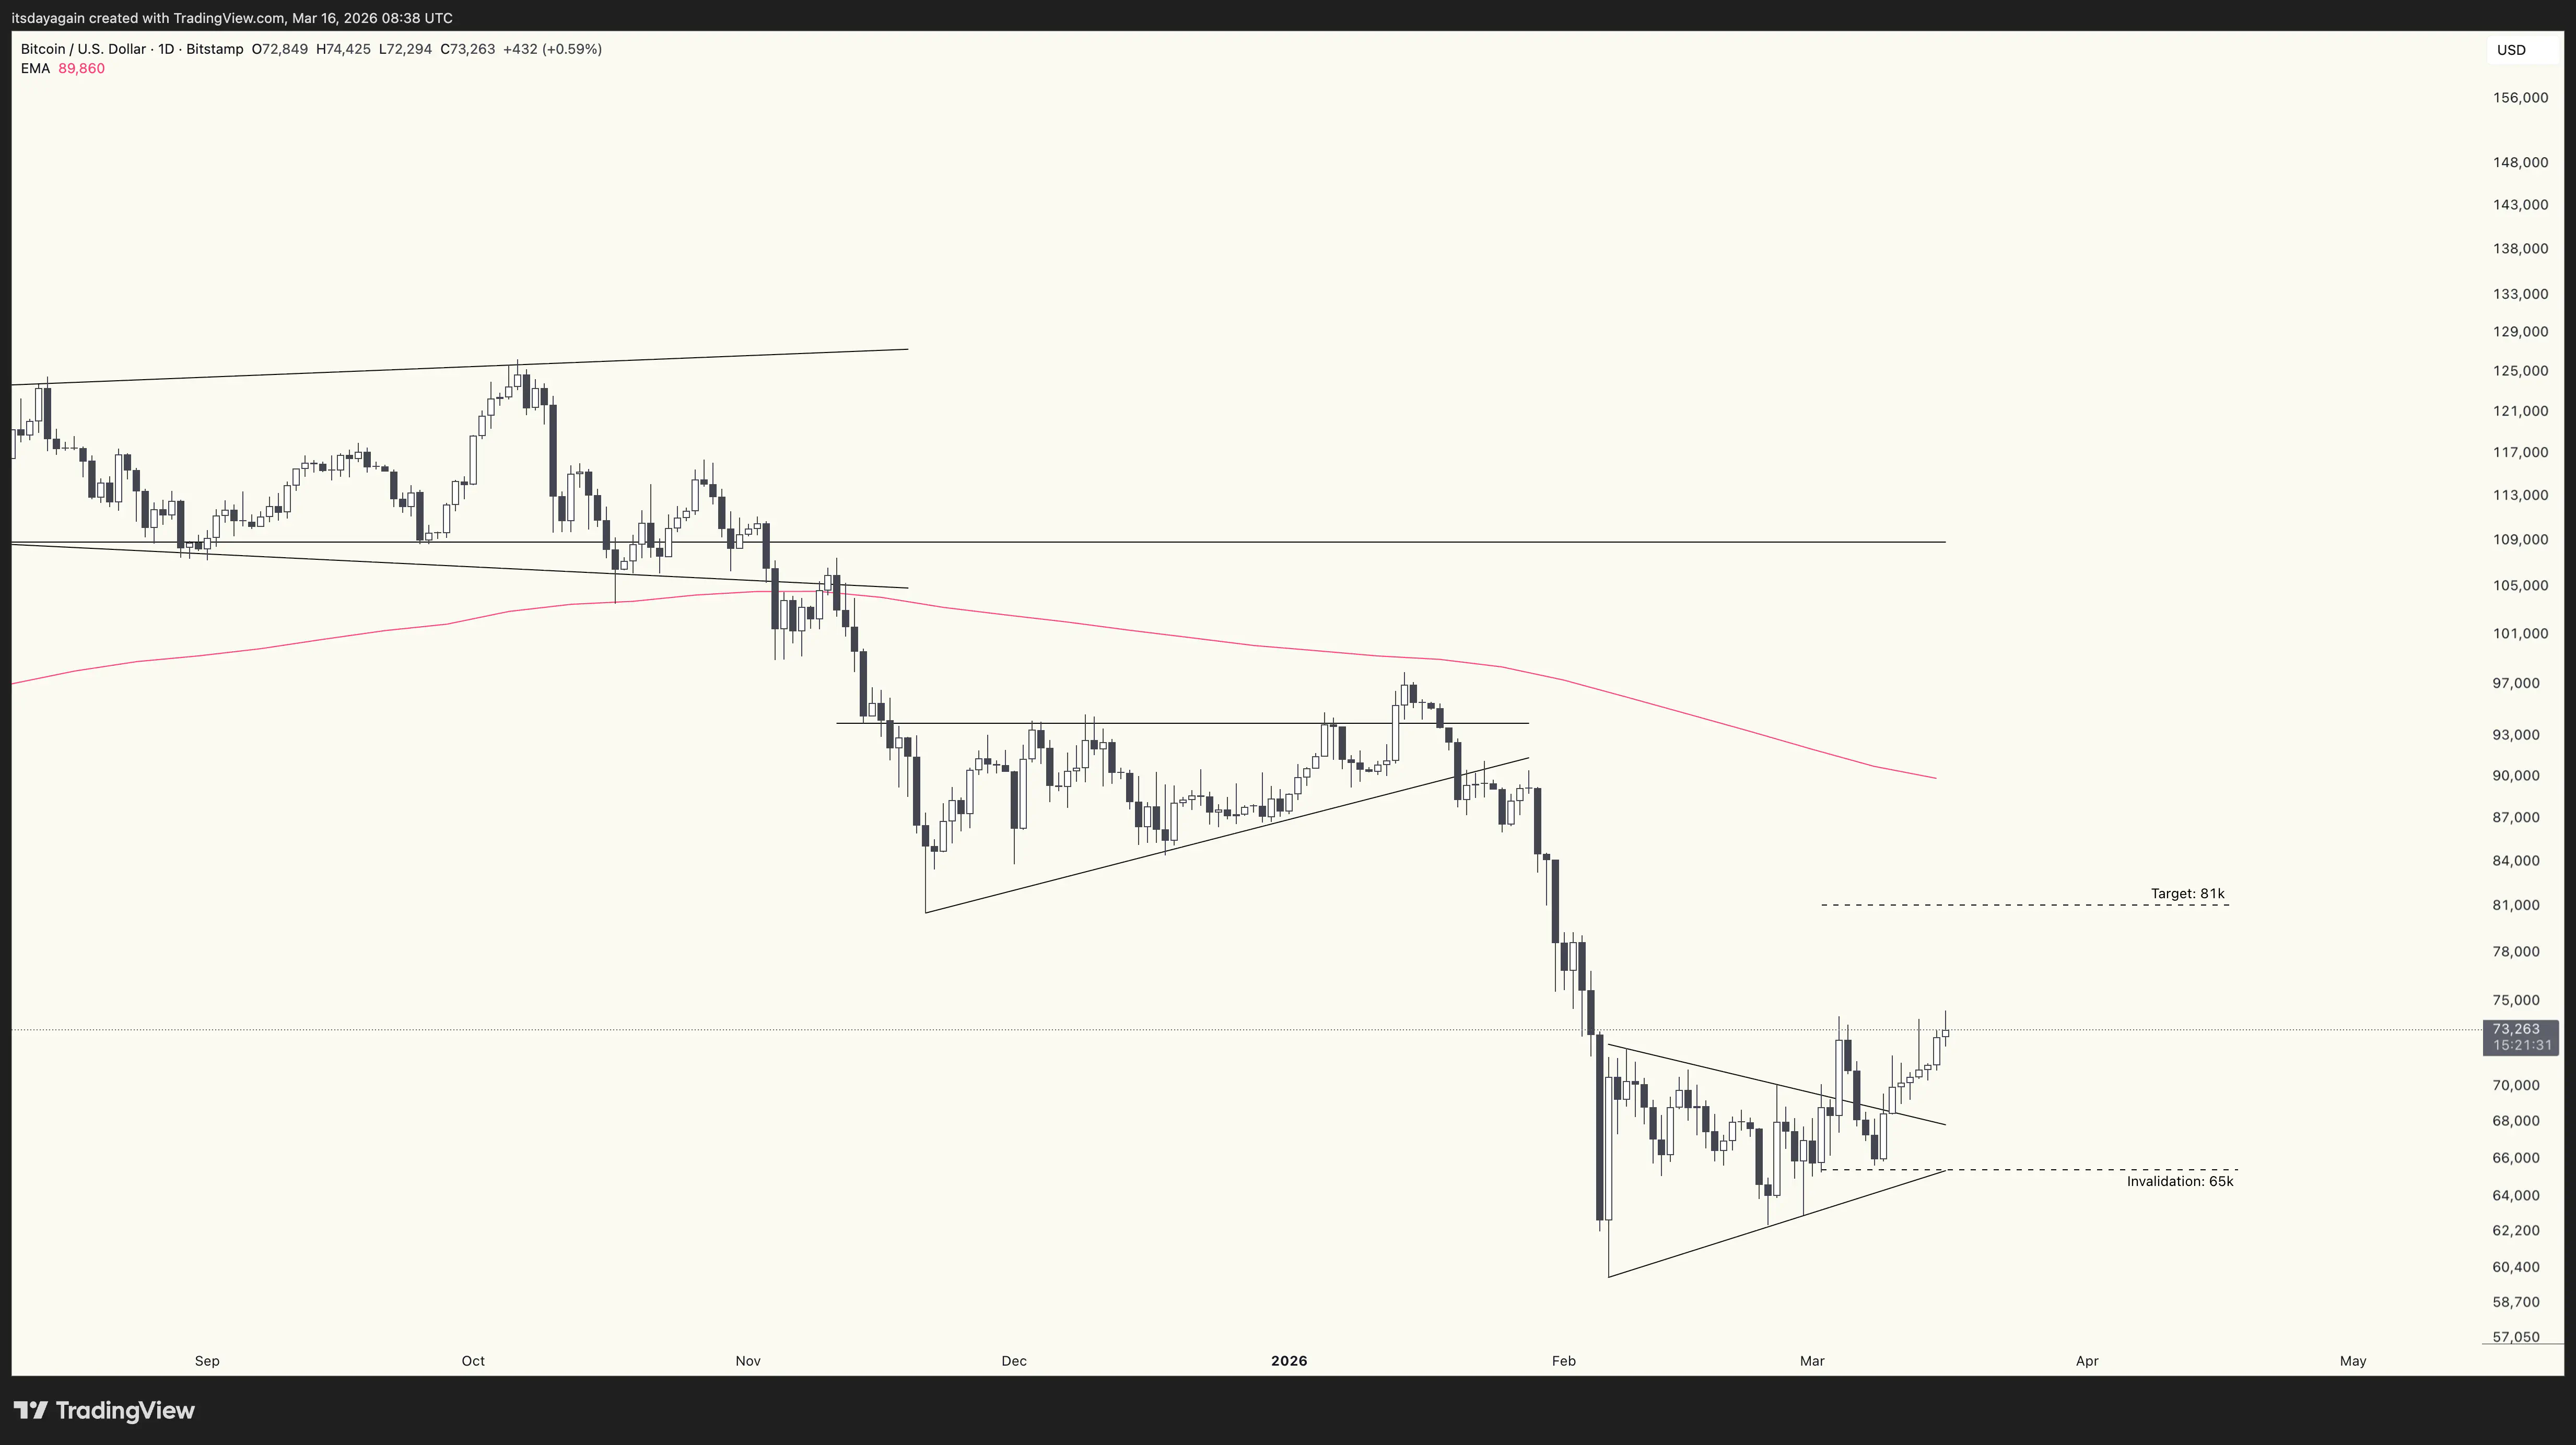
Looking to the daily chart, the small symmetrical triangle that broke out to the upside on March 4th is still in play, with a price target of 81k.
So we have both the daily and the weekly charts now showing signs of a reversal around the 70k area. The bear market rally scenario is still on.
Make no mistake about it though, bitcoin is still in a bear market. Stay cautious.