Bitcoin Weekly: Tech Stocks Break Down
Last week several key stock indices broke down, including both the S&P 500 and the Nasdaq 100. This could mark the start of a bear market. How deep and how long it will be is still not clear, but either way it’s not a good sign for bitcoin and the rest of crypto.
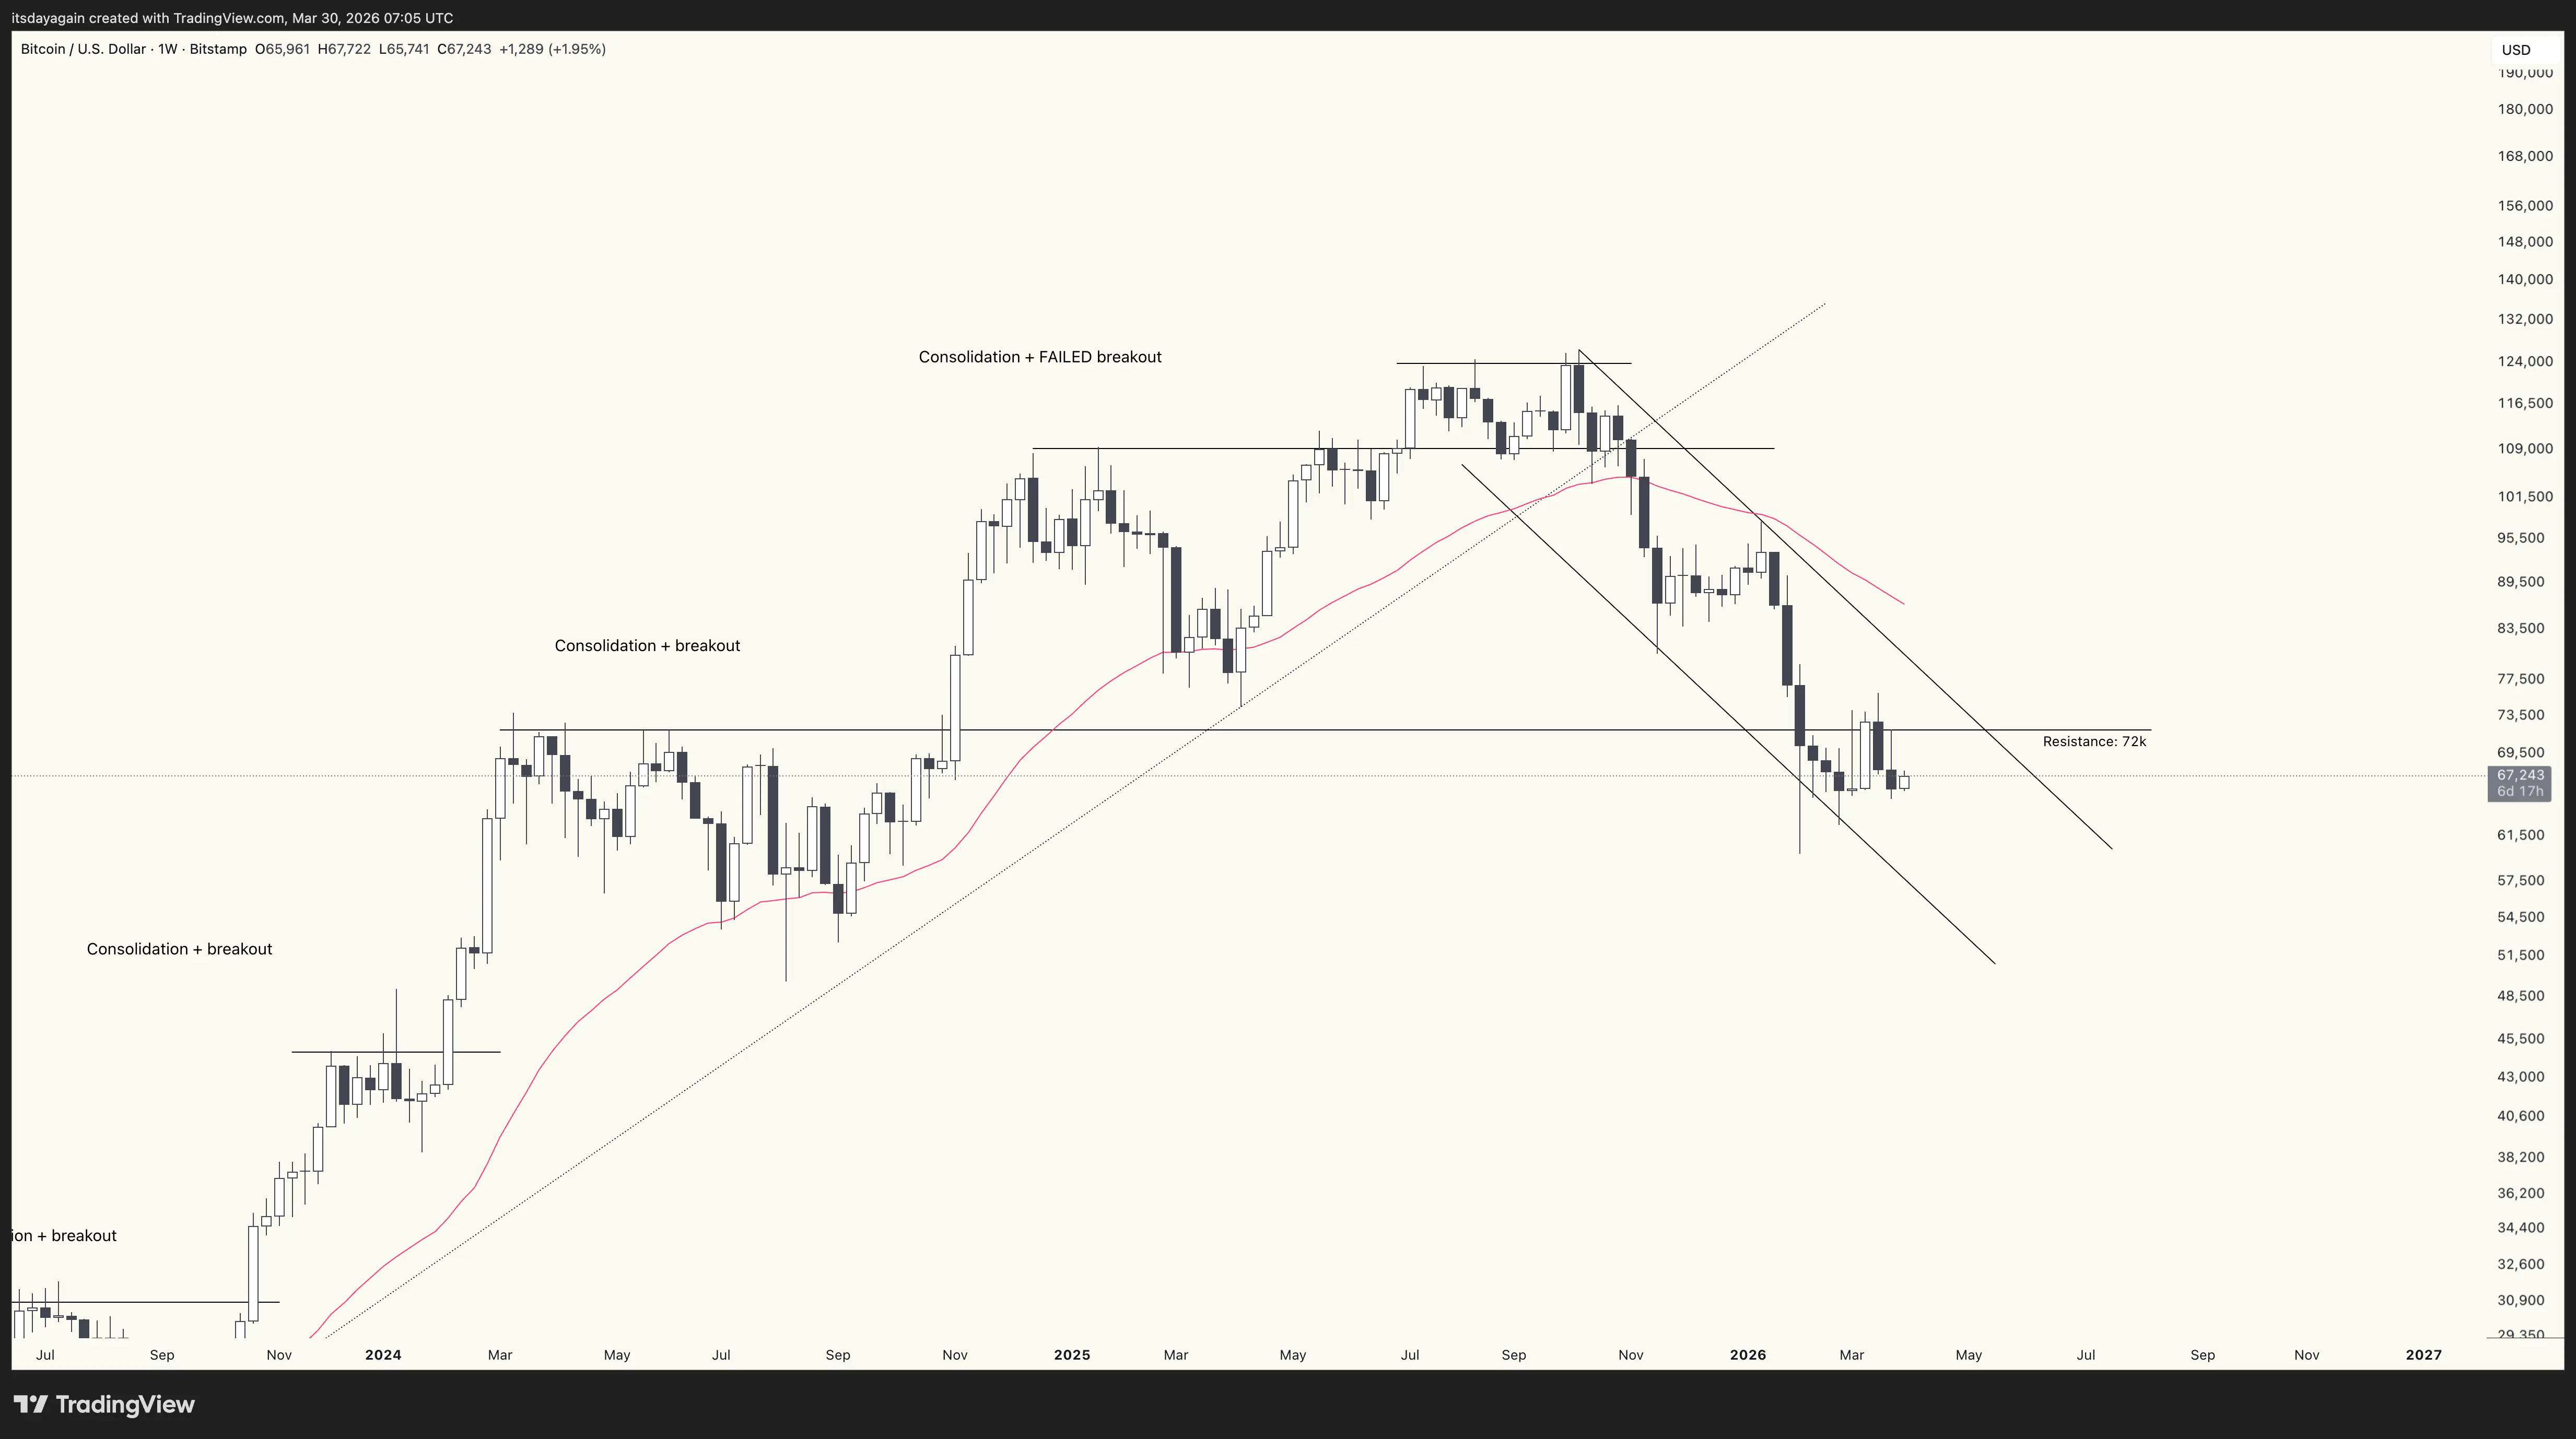
Let’s have a look at the bitcoin chart first. I have simplified the resistance levels this week, and now drawn a single line of resistance at 72k. Last week again was disappointing, closing below this level. I have also added a possible downtrend channel that we’ll keep an eye on going forward.
In summary, the situation remains the same: bitcoin is in a bear market. This is not the time to take on risk. Expect rallies to be sold off.
But the most significant thing last week was that US stock markets broke down. I first wrote about tech stocks being at an inflection point three weeks ago. At that point, tech stocks had not broken down. But last week they did.
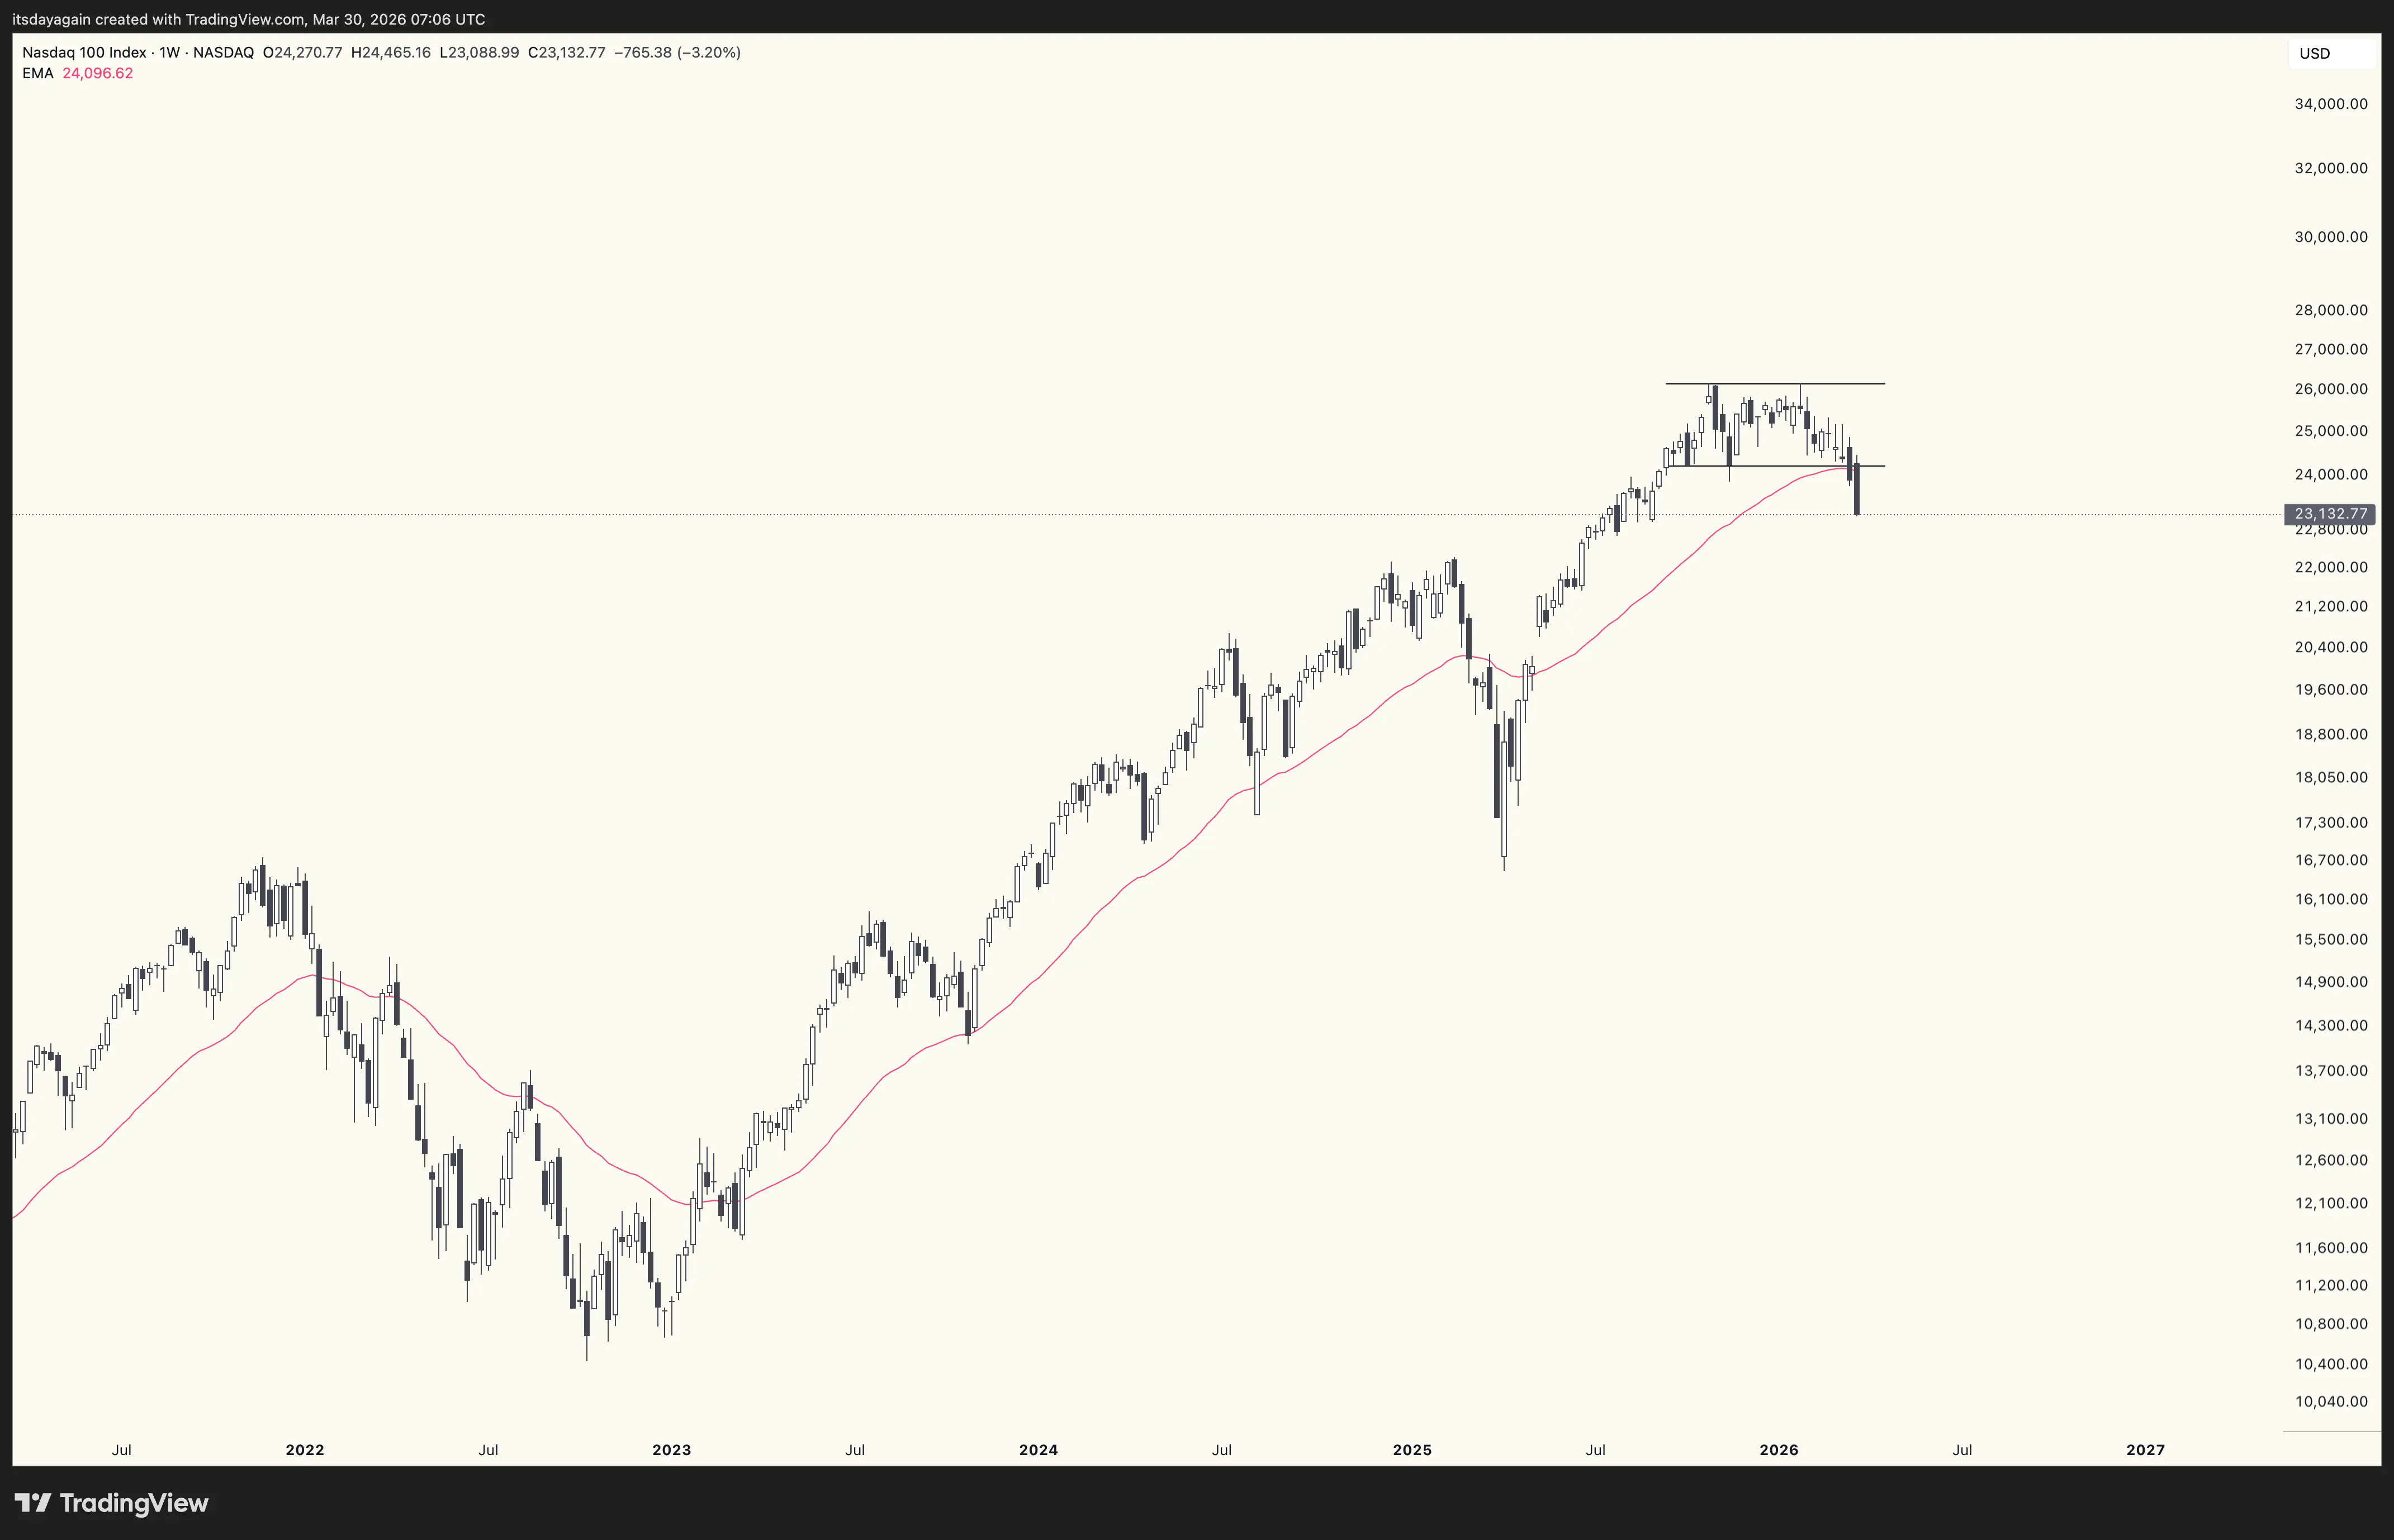
After ranging for the past 6 months, the Nasdaq 100 index (US tech stocks) broke to the downside. A long black candle confirmed a rectangle topping pattern, also clearly breaking down below the 200 day average.
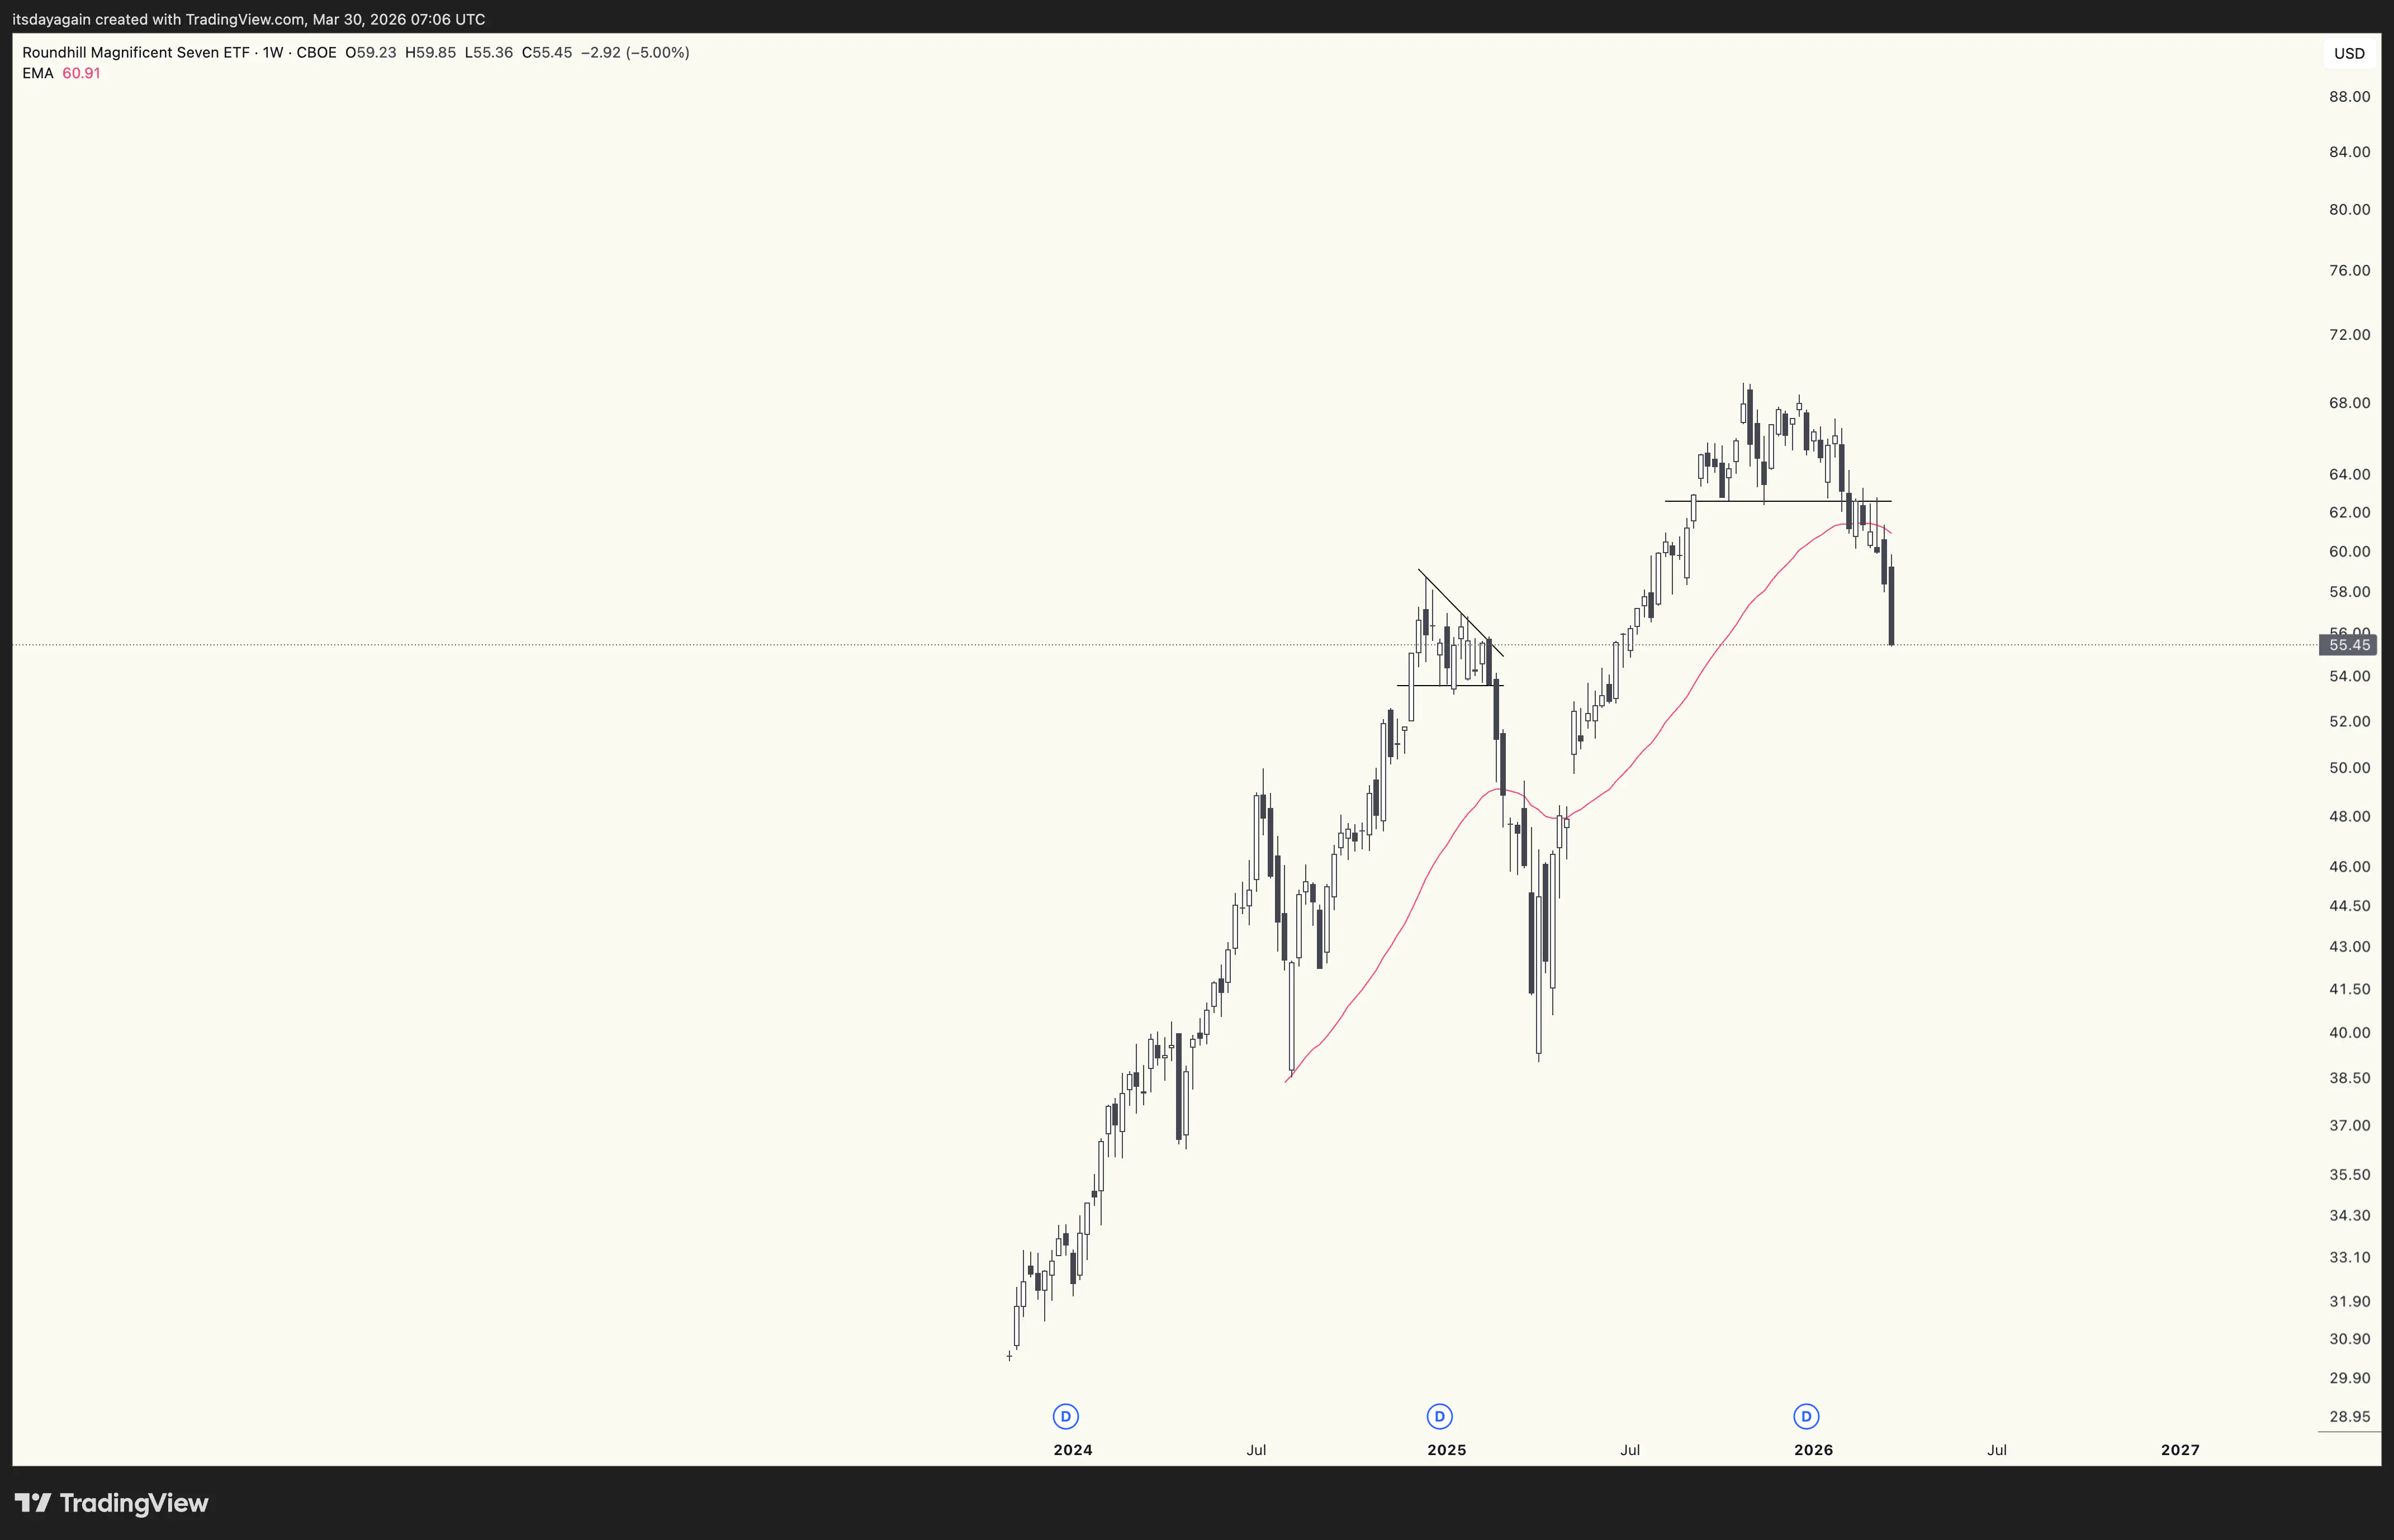
The chart for the top 7 largest tech companies, known as the “Magnificent 7”, already broke down the week before, and accelerated to the downside last week.
What does this mean?
It means that stock markets are entering bear market territory.
Will it be a shorter dip, followed by a quick recovery, like we saw in April last year? Or a longer bear market like in 2022-2023?
It’s too early to say exactly how this will play out. But the take-away message remains the same. We must now assume the trend has turned down, and that it will keep going down until there are clear signs of a bottom reversal. And like after bitcoin’s breakdown in November, we should now assume that stock market rallies also will be sold off, eventually leading to lower lows before the market turns around.
Again, this is not the time to take on risk.