Bitcoin Weekly: Wait and See
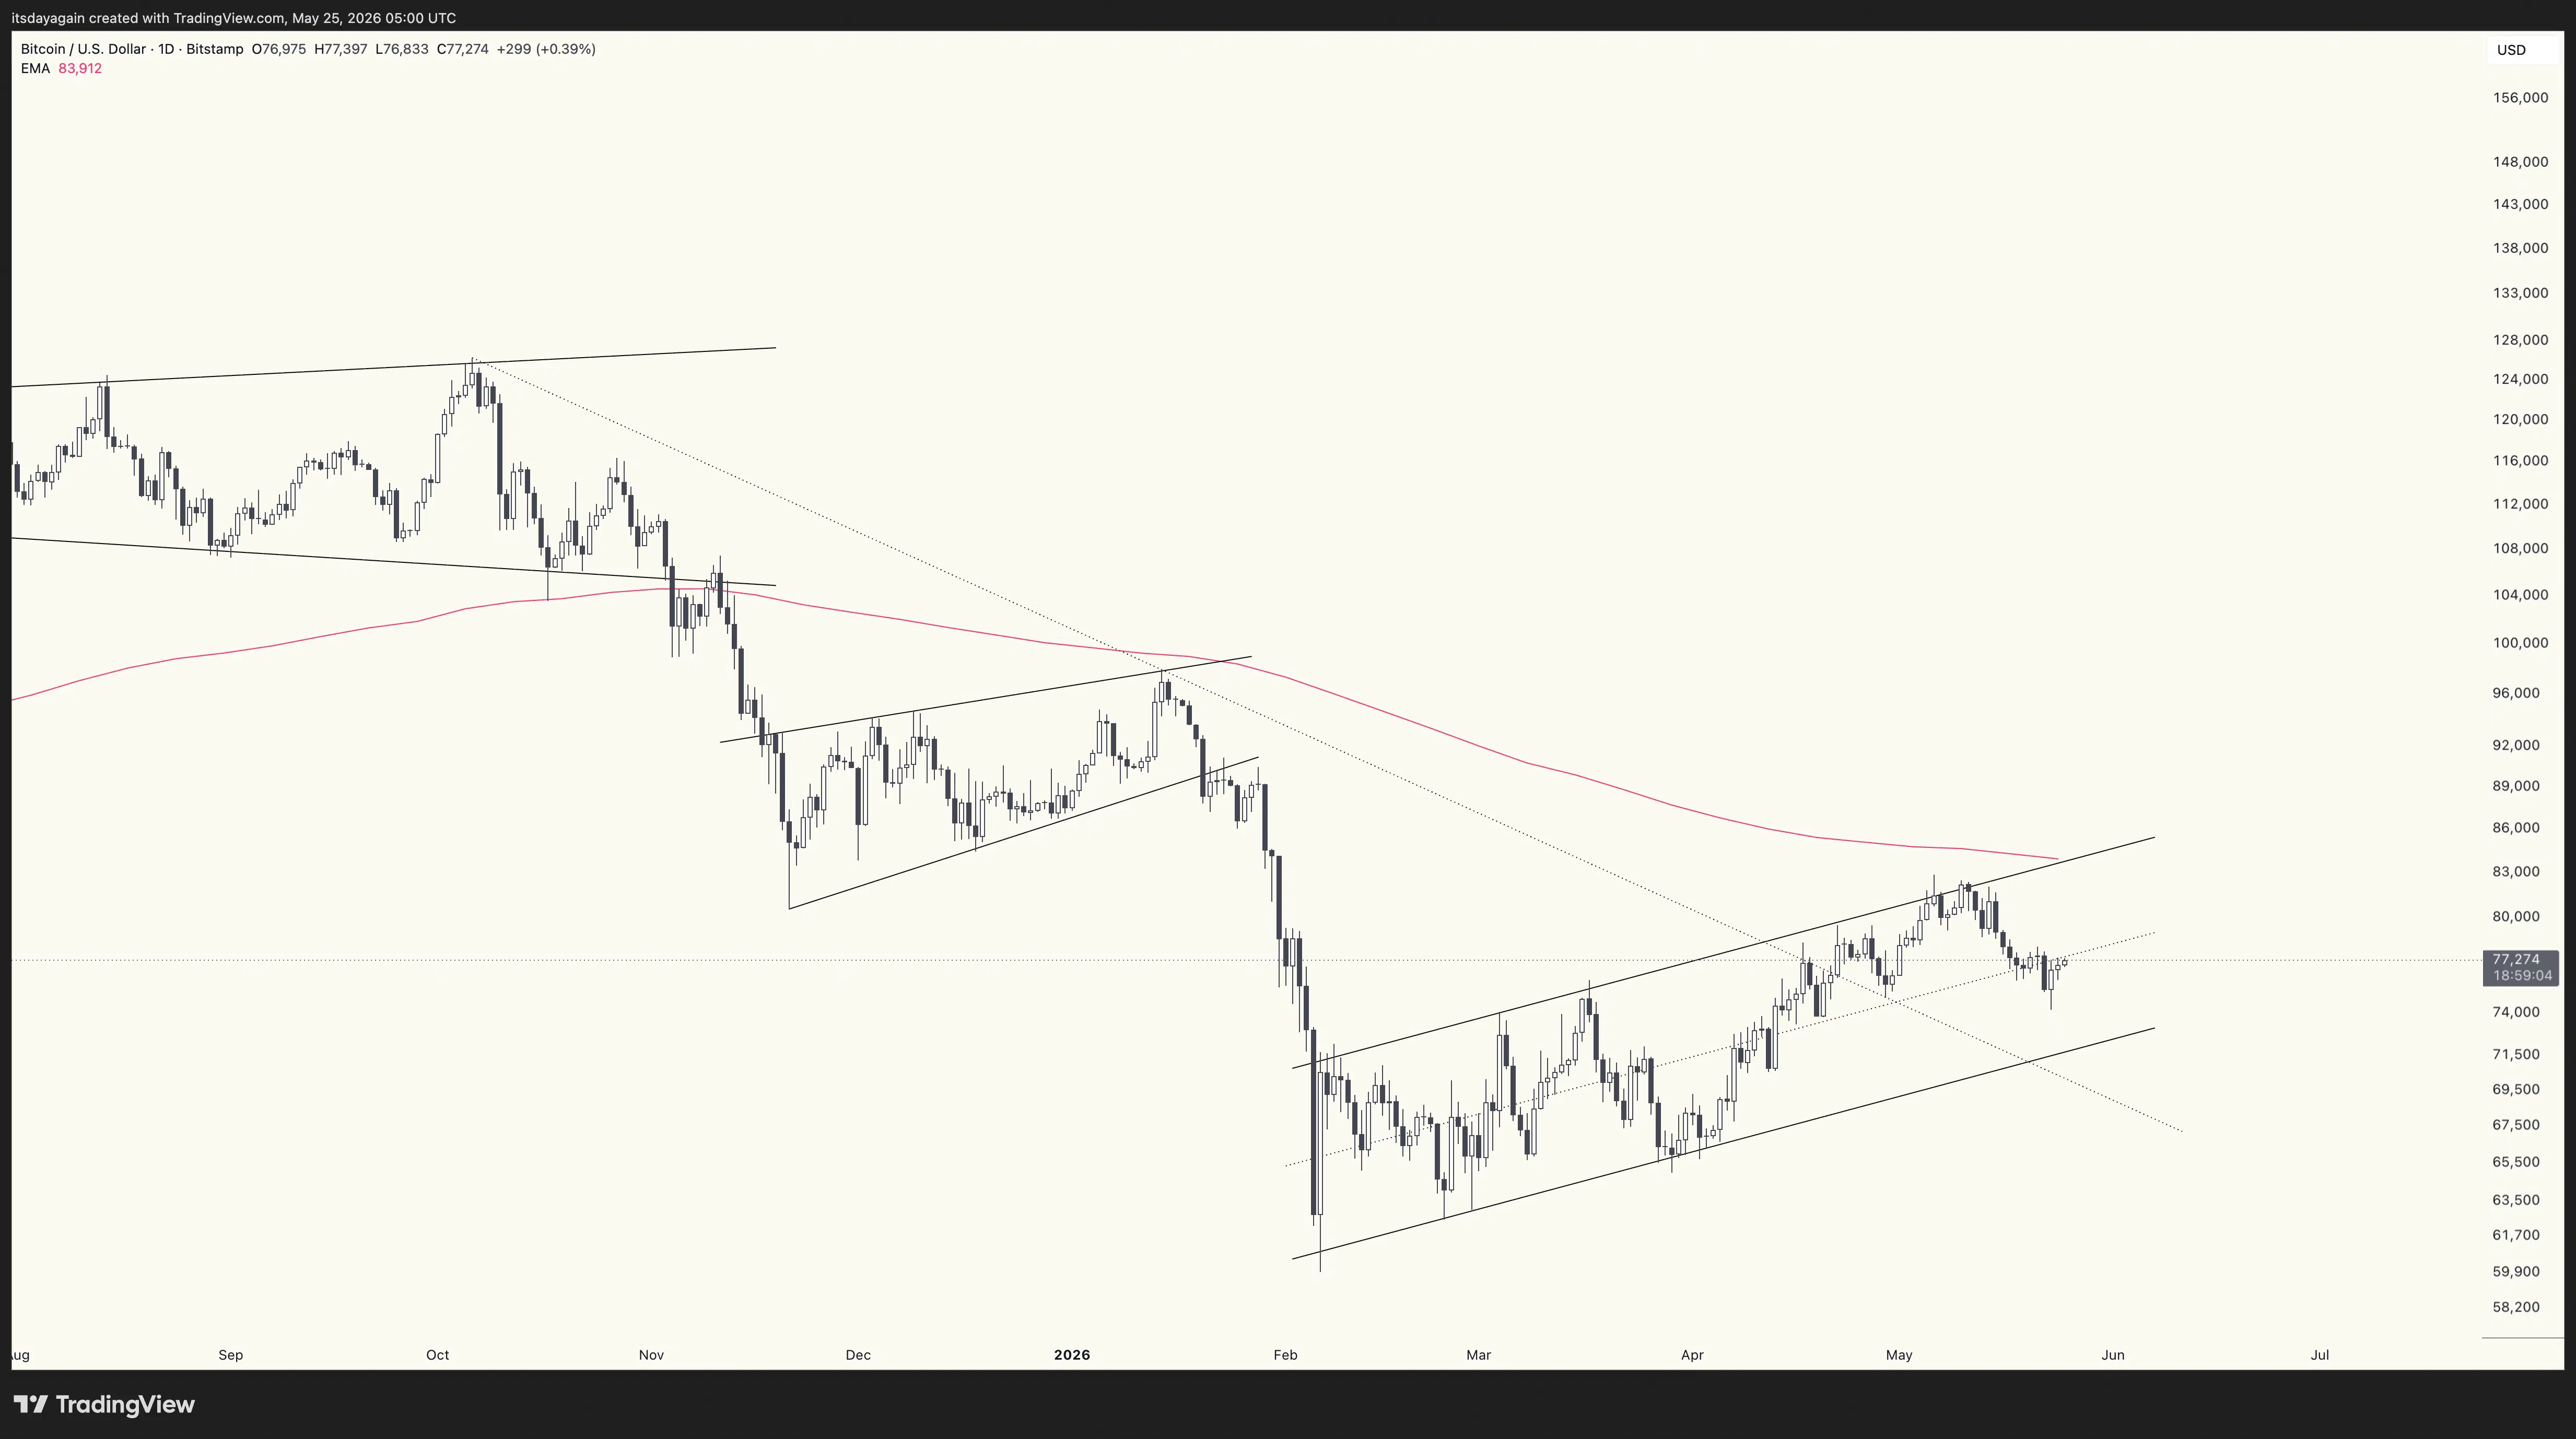
Stock markets are pushing new all time highs. But bitcoin remains in wait-and-see mode, stuck in the same old channel.
Nothing new has happened in bitcoin since last week.
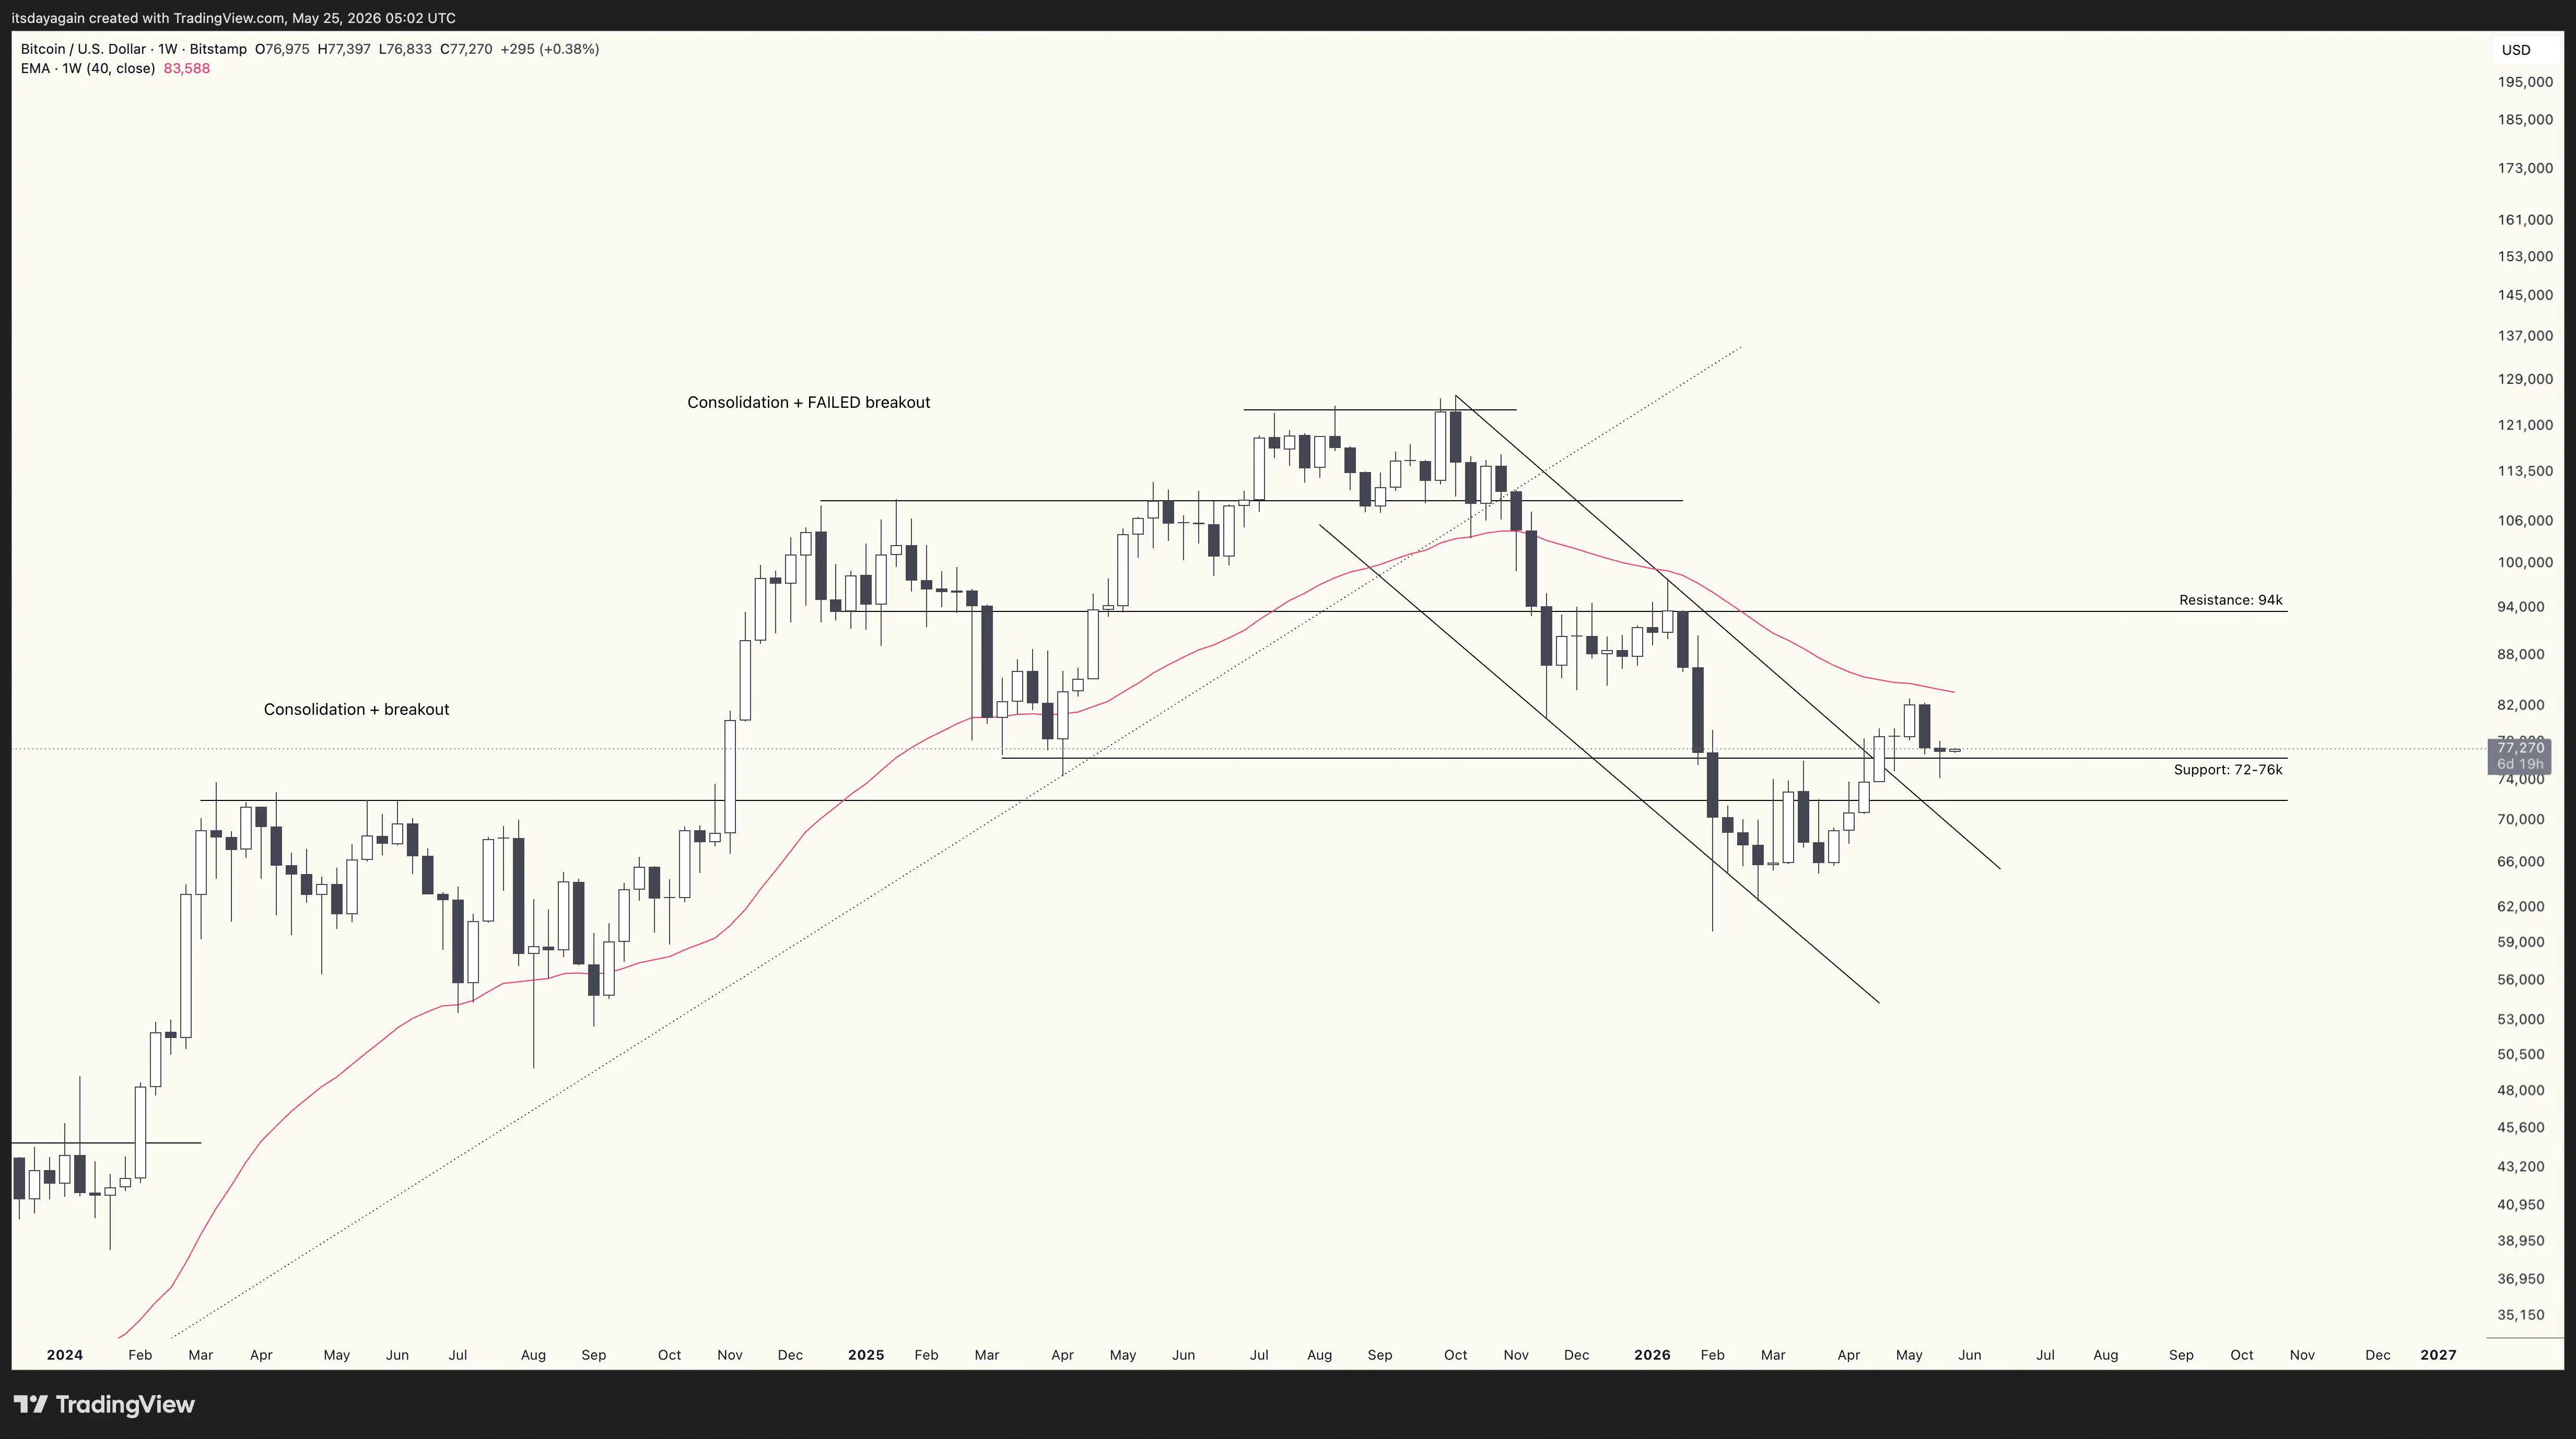
On the weekly scale, it’s still holding the support area around 72-76k.
On the daily scale, it’s still moving within the channel that started after the drop in early February. Trading a channel like this, you have four points of action:
- Buy a breakout.
- Sell a breakdown.
- Buy support at the lower edge.
- Sell resistance at the upper edge.
Until any of these happen, you simply wait.
Personally I don’t short, and I’m not interested in trading a narrow range like this channel. That leaves only option 1 for me, and so I’m waiting to possibly buy a breakout. As mentioned last week, a breakout above the channel would be interesting now, as it would also cross above the 40 week EMA (pink line).
Wait and see.