Bitcoin Weekly: Bear Flag Price Target 50.7k
Last Tuesday, bitcoin broke down from the parallel channel it had been trading in since early February. This move confirmed a bear flag on the daily timeframe, setting up a price target at 50.7k.
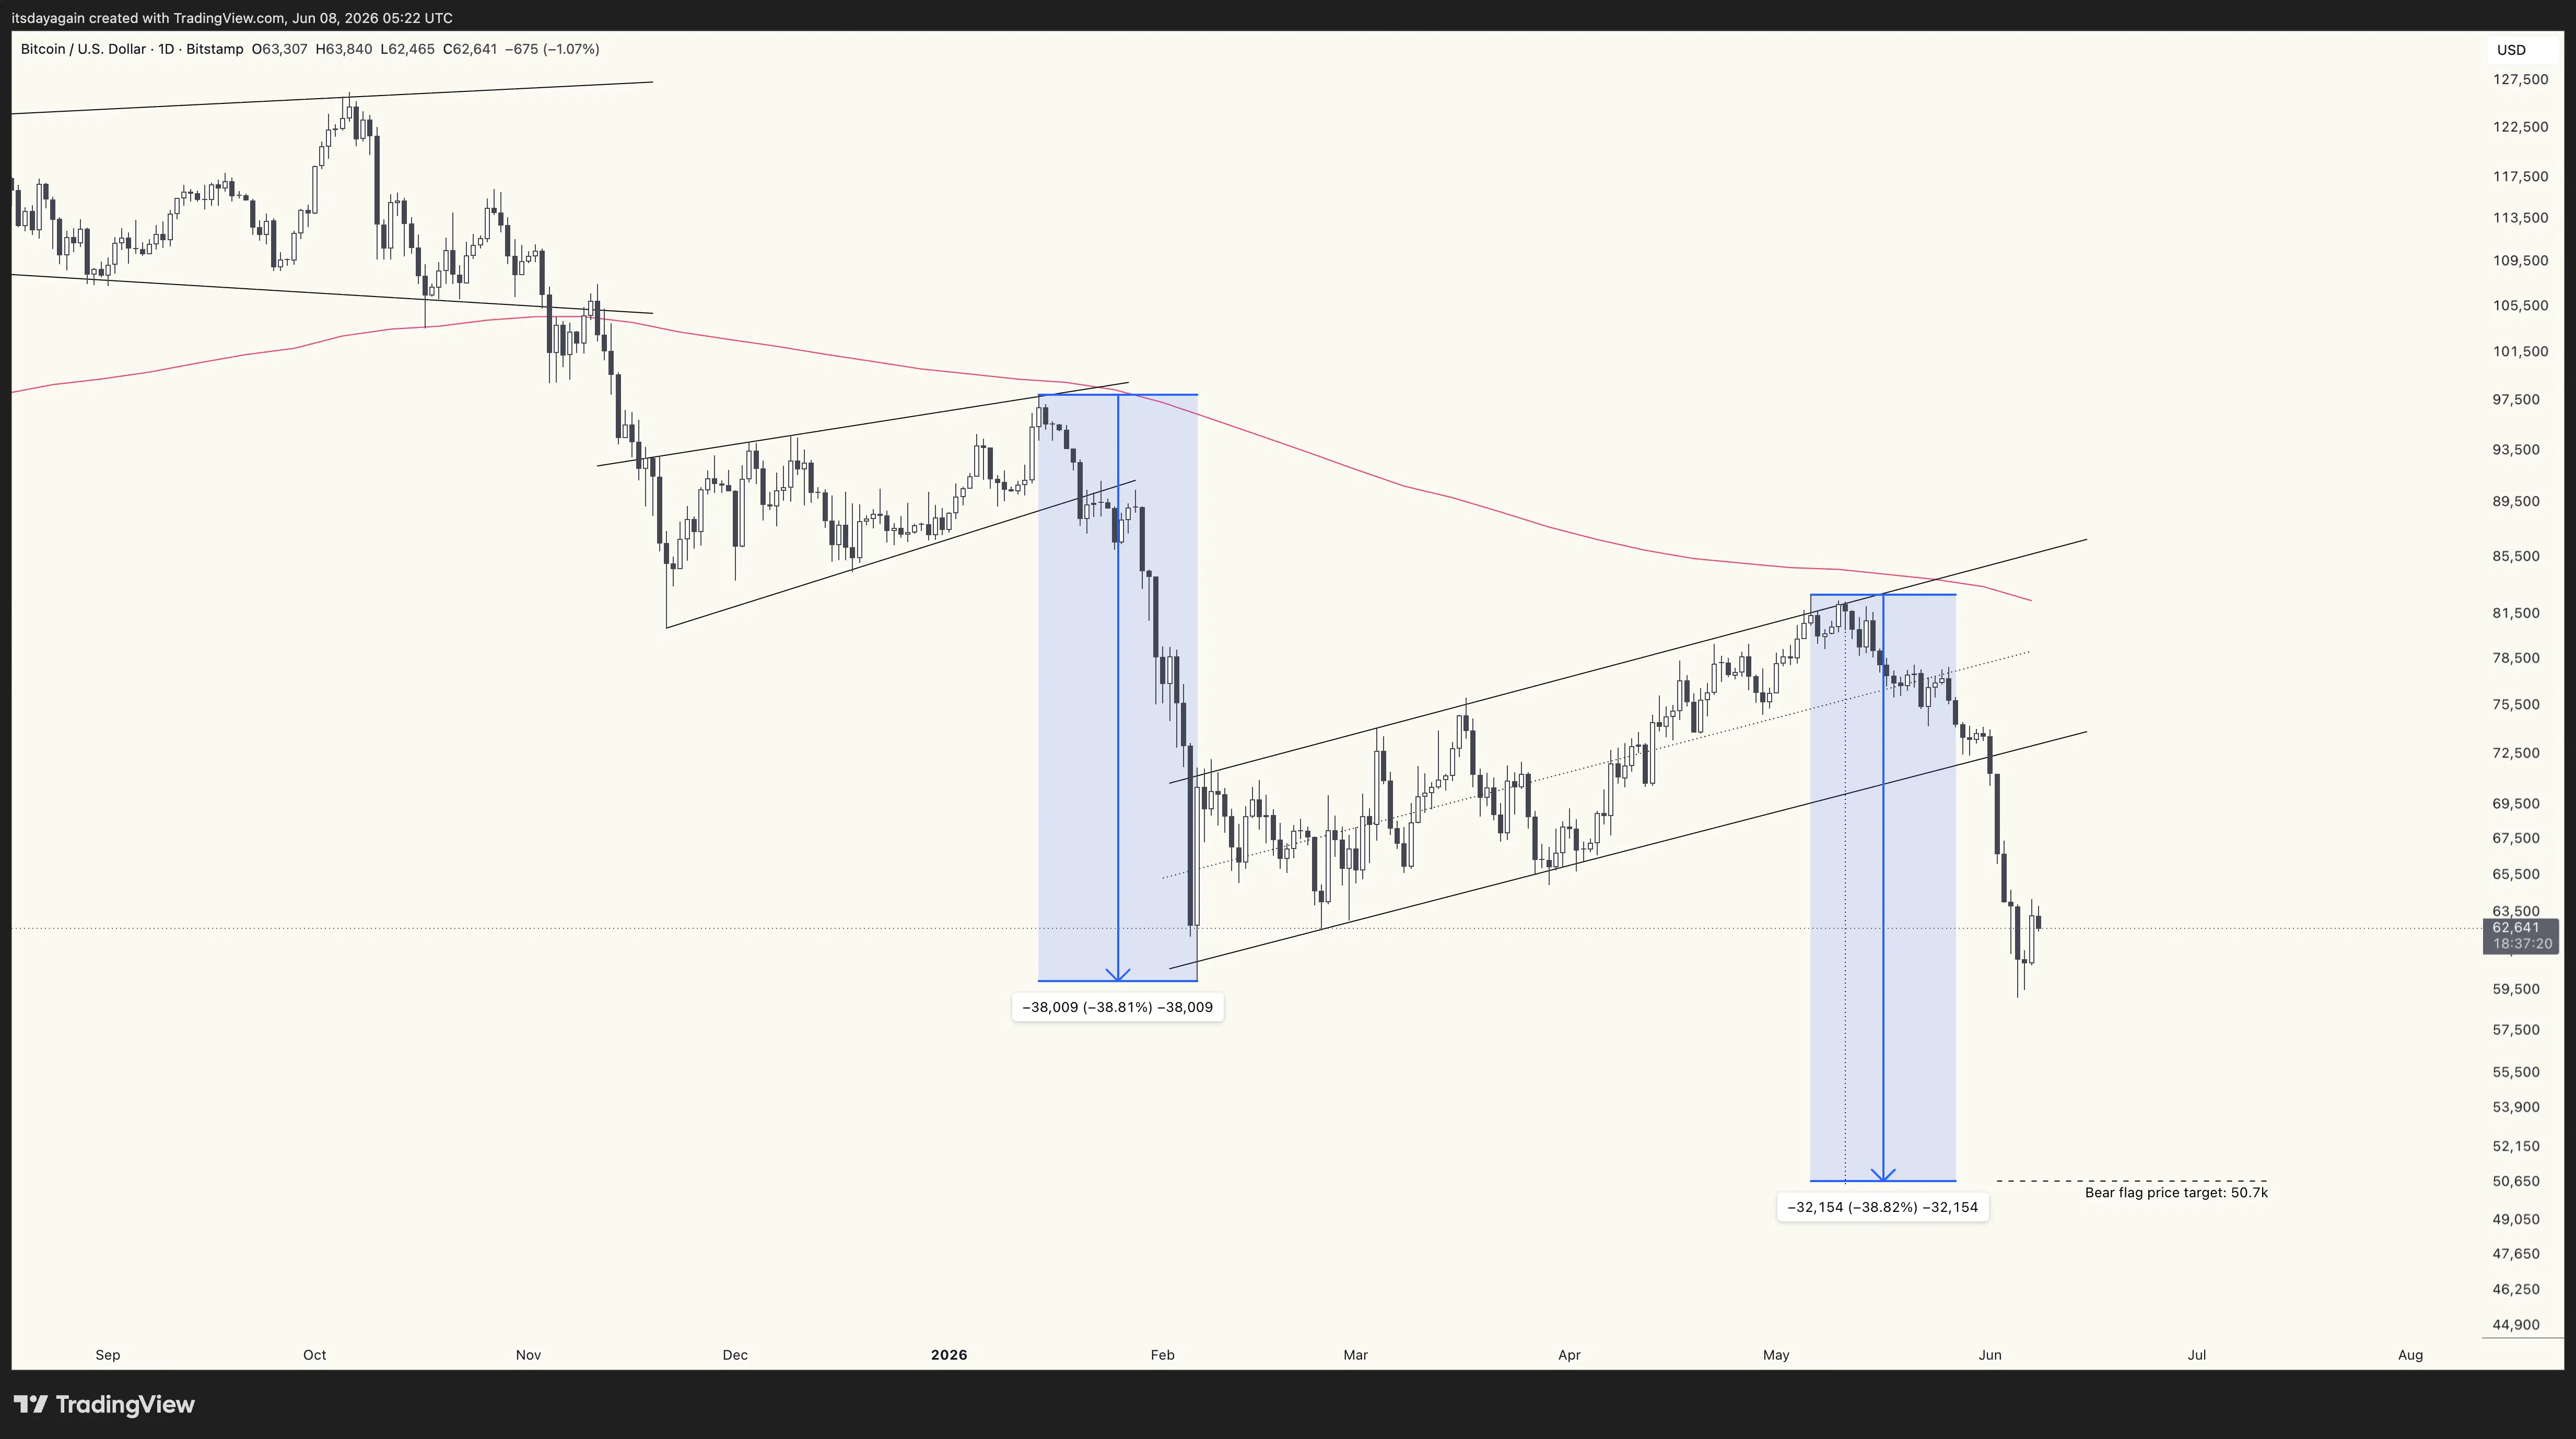
The technical support at the bottom of the channel was not enough to keep bitcoin floating for long. Instead of bouncing, it clearly broke down, with a long black candle closing well below the channel boundary. This confirmed a so called “bear flag”, meaning a breakdown from a shorter counter-trend move within a larger downtrend.
As the name implies, the bear flag is a bearish pattern. You can get a price target for this pattern by measuring the move that led into the flag, and extend that measurement downwards. If you do this, you end up with a 38.8% drop from the top of the flag, putting the price target at 50.7k. (See the chart below.)
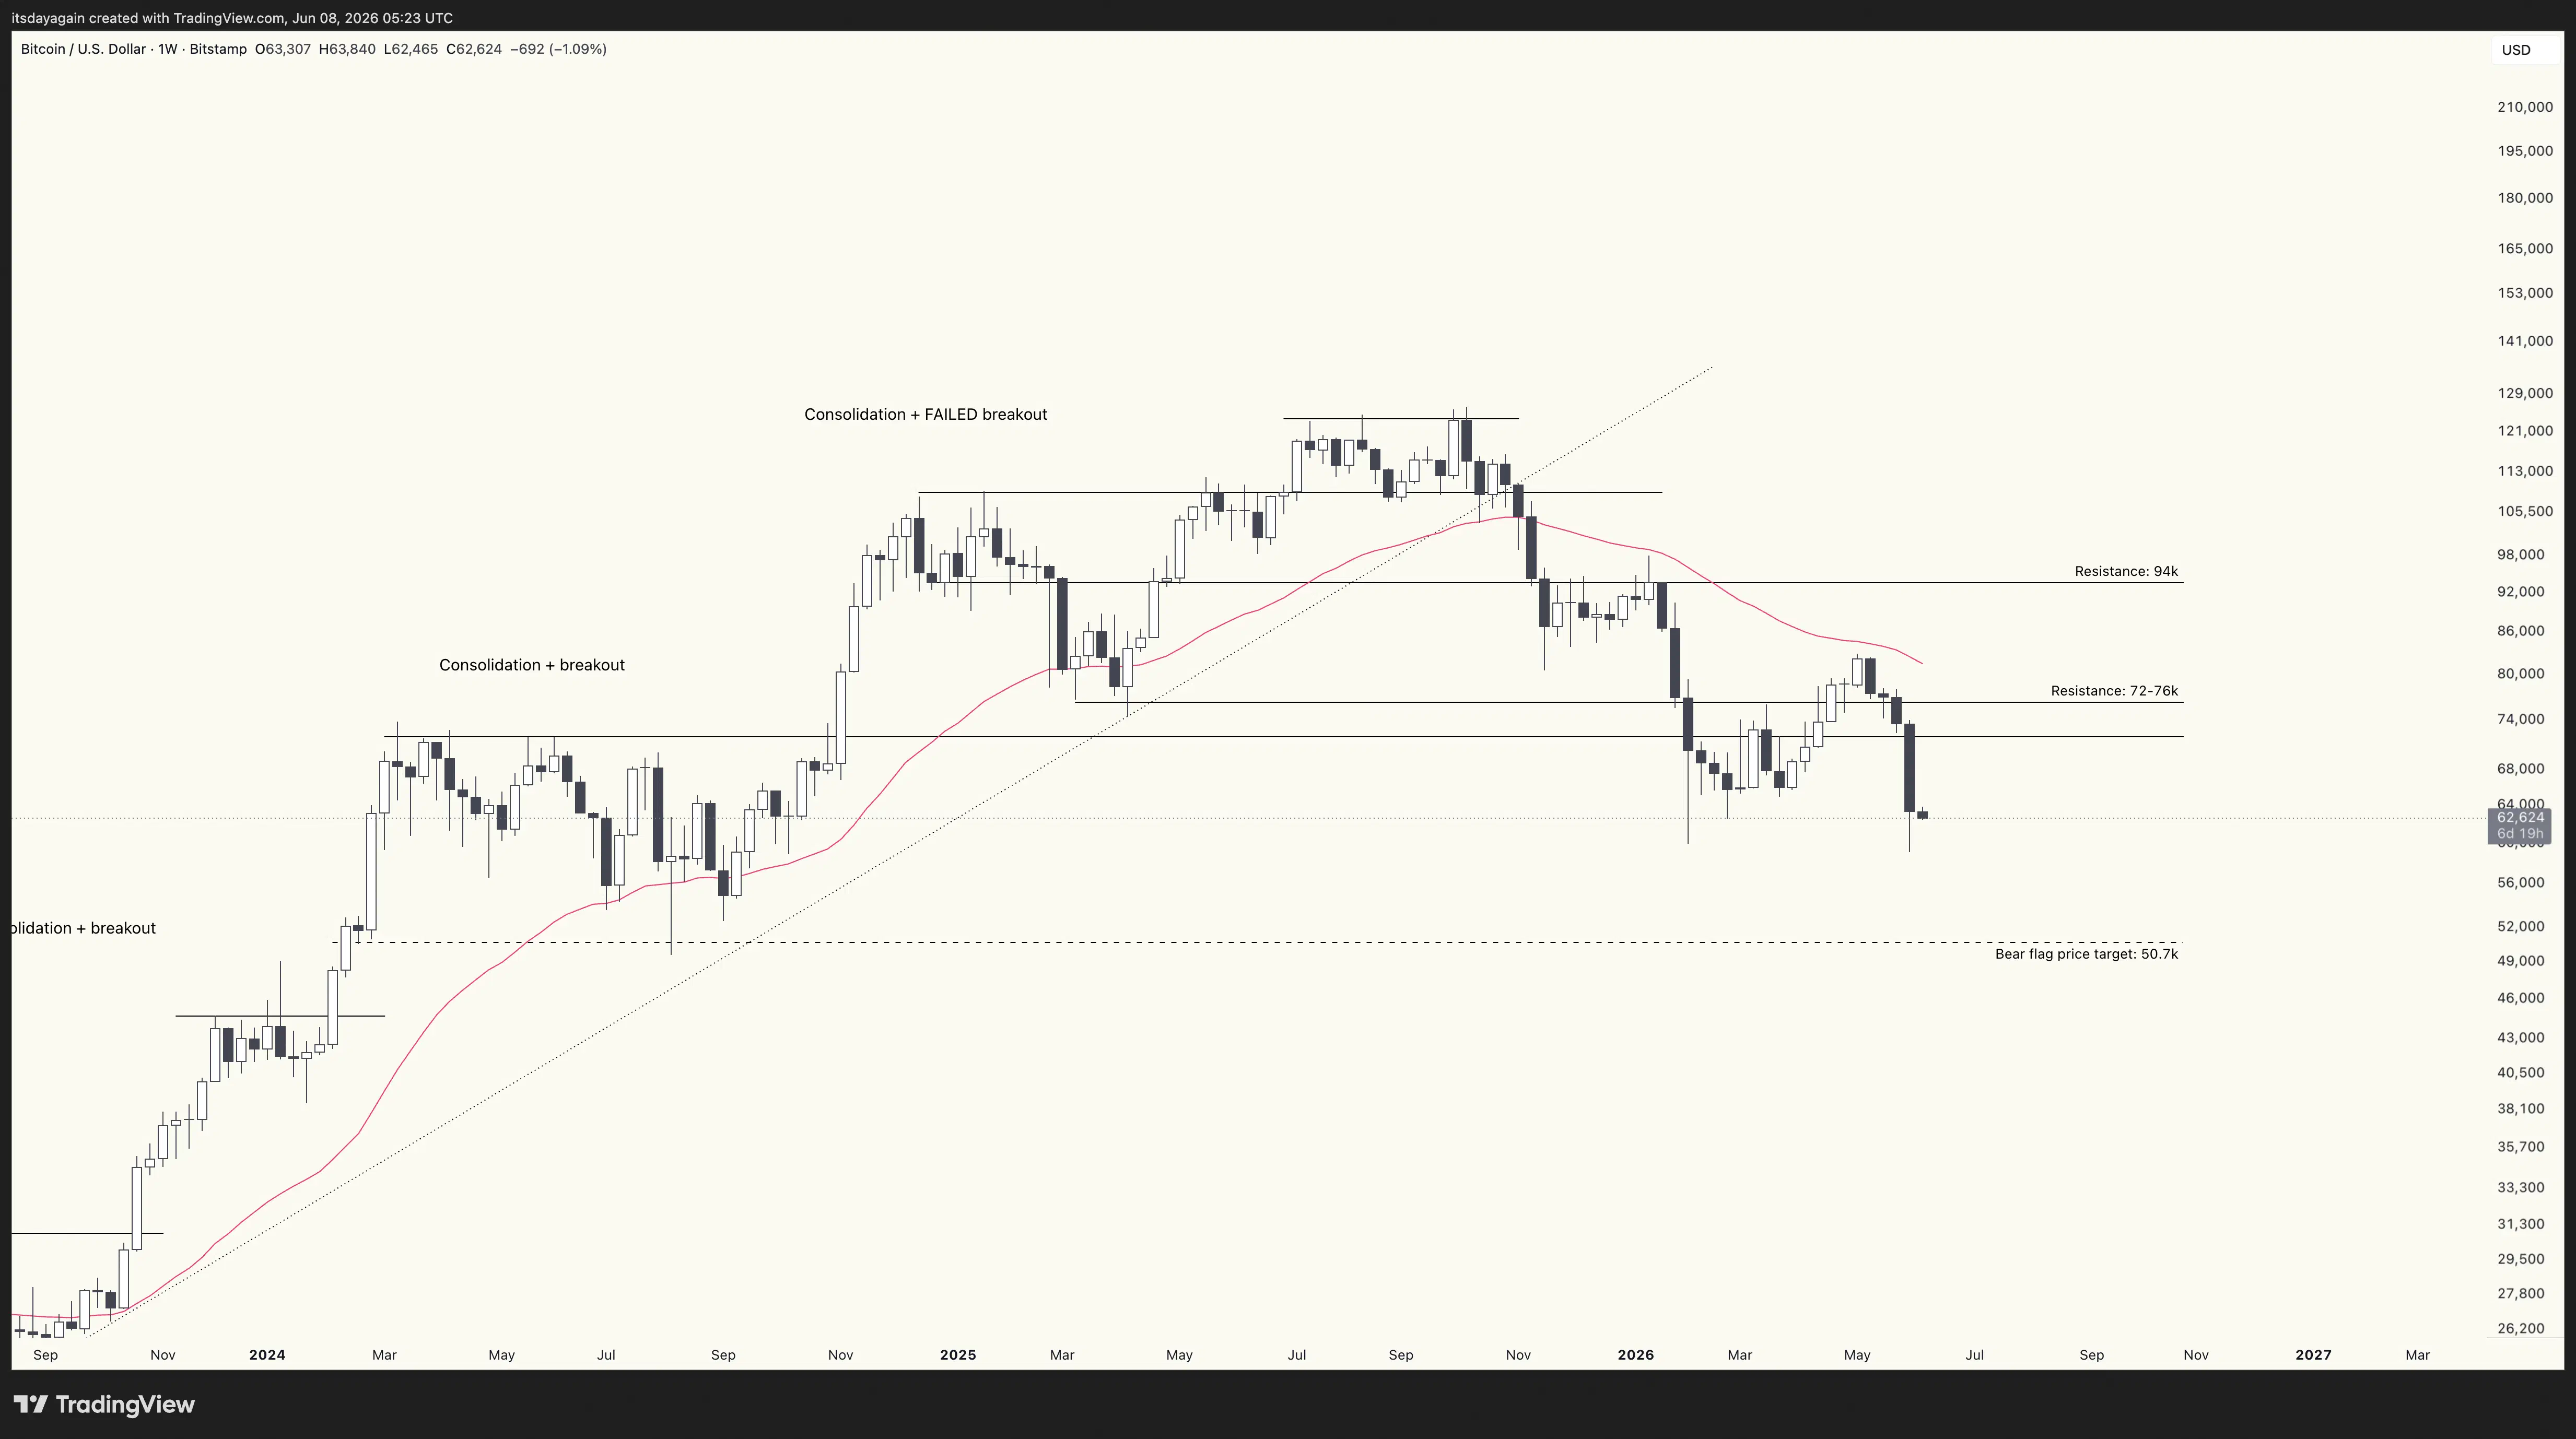
On the weekly timeframe, you can see that this 50.7k level lines up with the bottom from August 2024, which could offer technical support.
What’s important to note here is that this price target is NOT a prediction. That’s not how technical analysis works.
But it does become the base case, until something else happens that invalidates the thesis. For example if bitcoin finds support here, and then moves up above 82k, then you have a double bottom in the chart, and that would change the outlook. (I’m sure some people are already calling this a double bottom right here, but it’s way too early to say that.)
Zooming in a little bit, bitcoin is finding some technical support from the February low at 60k. So in the short term, that’s the level to watch.
Bitcoin is getting cheap. But personally, I’m not buying yet.