They Call It “The Bible of Technical Analysis”. Is It? Yes. Should You Read It? Maybe.
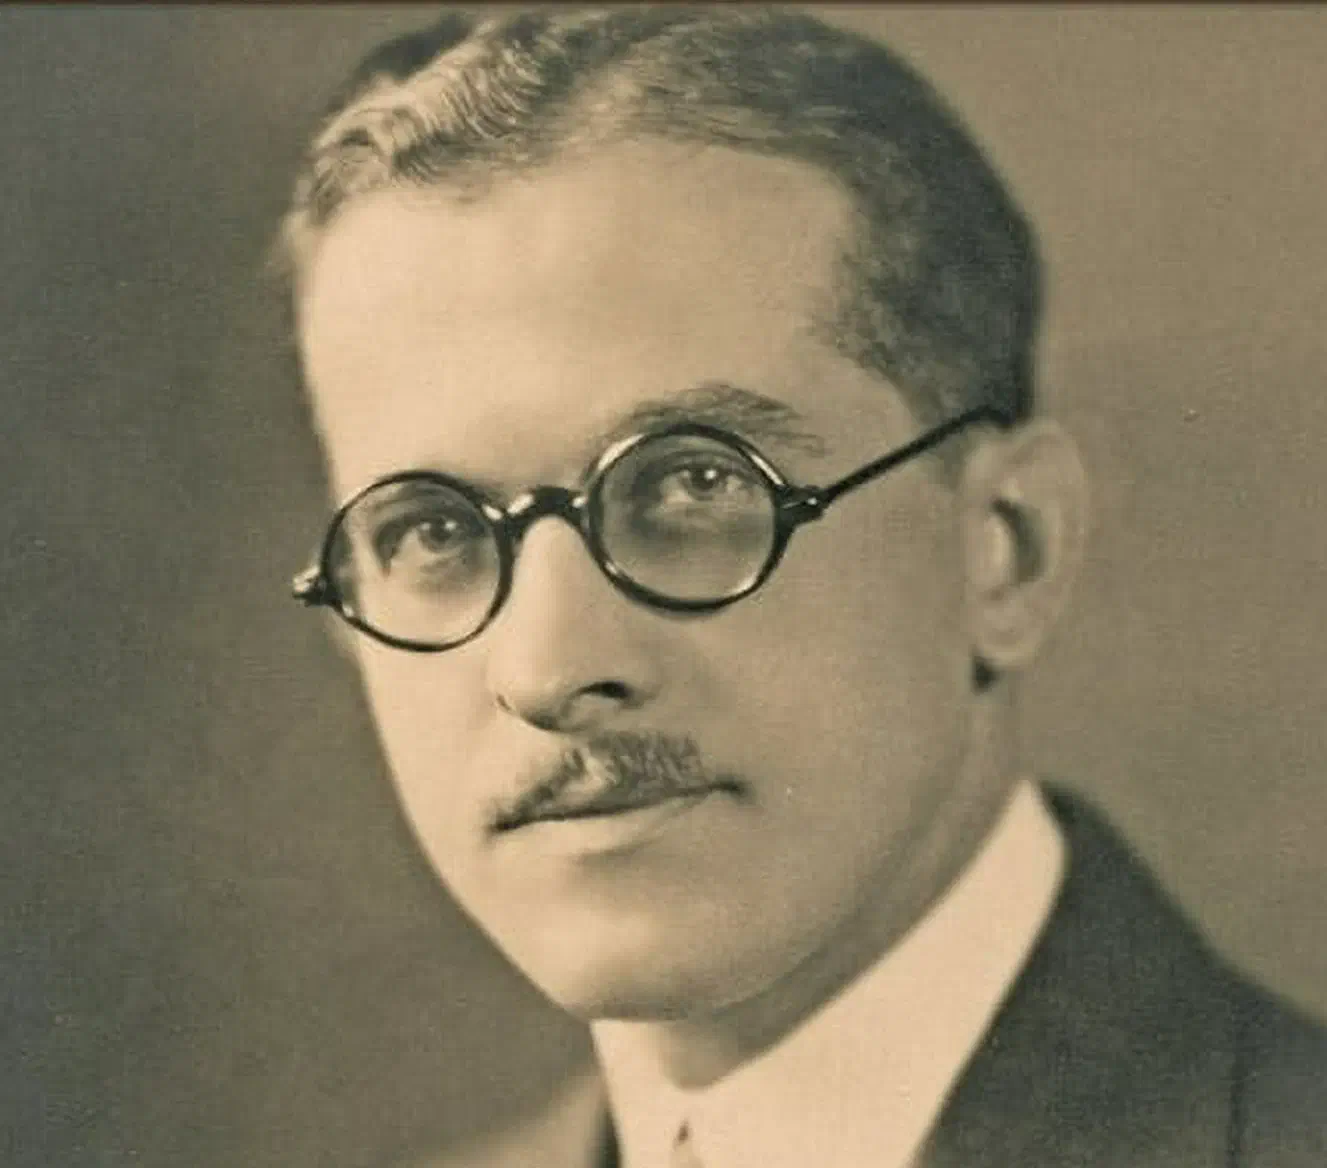
On September 7, 1935, Richard W. Schabacker took his .22-caliber rifle, aimed it at his right temple, and pulled the trigger.
Two hours later, at the local hospital, he was declared dead. He was only 36 years old. It’s not clear why he chose to end his life this way. The news reported that he suffered a nervous breakdown. But whatever the cause, it was a tragedy.
That Saturday three infant children lost their father, a wife lost her husband, and the world lost a genius financial analyst.
The Groundbreaking Work That Was Almost Lost To Time
Despite only living to 36, Schabacker is now widely considered the grandfather of technical analysis.
In his short life, he accomplished quite a lot. A prolific writer on finance and stock market trading, he spent 7 years at Forbes Magazine as the highly regarded financial editor. He wrote more than 440 articles and columns, as well as two books, and a comprehensive course on stock market trading.
This trading course was later published as a book, and this is the masterpiece I want to talk about today.
Technical Analysis and Stock Market Profits: A Course in Forecasting. That was the title of the book when it was first published. It was only printed in about a thousand copies, and in the shadow of Schabacker’s early death, it was almost lost to time. But as it happens, the work was picked up by two influential writers, which breathed new life into Schabacker’s work and his legacy.
Since the late 90’s, the original book is available in a nice hardcover print from Harriman House. The title of the new edition is Technical Analysis and Stock Market Profits.
Also known as the “bible of technical analysis”.
The Original Bible of Technical Analysis
With this book, Schabacker established the field of technical analysis as we know it today.
At 450 pages, it’s a hefty piece. Both in terms of physical size, but also in terms of content and details. Through 12 chapters, Schabacker thoroughly describes all the principles of his craft, with lots and lots of examples.
He first introduces the concept of technical analysis, as opposed to fundamental analysis.
In fundamental analysis, which was already common at the time, you look at balance sheets, margins, sales, forecasts, and so on. All the underlying factors that should influence the price of a company’s stock. You try to figure out the fundamental value of the company, to judge if it’s a buy or a sell at the current price.
In technical analysis, you take all that, and you throw it out the window.
Instead, you only focus on how the stock is trading on the market. That’s it. You study how the price and trading volume is developing from day to day, from week to week. What the buyers and sellers are actually doing in the market.
The idea being that everything you need to know is already reflected in the price itself.
After explaining the foundations, Schabacker guides us through the pillars of technical support and resistance. He covers trend lines in depth. He introduces all the classical chart patterns, with names like rectangles, triangles, head & shoulders, flags, and more.
At the end of the book, he has established a full system for trading, based on technicals alone.
Now, Schabacker wasn’t the first to come up with the idea of technical analysis. It had been touched upon by several others before his time. But Schabacker was the first to develop and present it as a whole system, with clear rules for how to apply it to trading.
That’s why he’s widely recognized as the grandfather of technical analysis.
And that’s why this book rightly should be considered the bible of technical analysis.
Is Technical Analysis Astrology For Men? Yes and No.
“Astrology for men”.
That’s what some people call it.
To these people technical analysis makes no sense. Analyzing price charts by drawing what seems like random lines on them, and then just based on that decide when to buy and sell. On the surface it seems absurd, and so they dismiss it as superstition and make-belief.
Are they right?
Honestly, yes. Most of the time, they are. At least judging by the majority of technical “analysis” on YouTube, X, and other social media.
The sad truth is that most people go about analyzing charts the completely wrong way. They draw too many lines, with no real system to guide them. They pile on indicator after indicator, until their charts turn into an incomprehensible soup that can support whatever narrative they want.
That kind of chart-slop is little more than astrology for men.
But then there are the few chartists whose analysis stand out as a breath of fresh air in its simplicity and clarity. People like Peter L. Brandt and Aksel Kibar. When you see their analysis and their clean charts, it just makes sense. And also the hard numbers don’t lie: it actually works.
Some people call this style of technical analysis classical charting, classical technical analysis, or classical TA for short.
But whatever the name, it has one thing in common.
It all comes straight from Schabacker’s work.
The Book Is a Fascinating Read for Two Reasons
First, all the fundamental principles still hold up today.
The book is full of example charts from the 1920’s and 30’s, and on these charts the exact same patterns show up as on charts of today. You can literally take any example from the book, open up TradingView, start browsing through charts, and you’ll see the same pattern show up again and again and again.
Which means the book is actually still useful as a guide for trading.
Not on its own, because it doesn’t cover stop loss strategies, risk-to-reward analysis, or how to use modern tools. But for learning the fundamental method, the concepts, and the basic patterns, all from the original creator of the field, it’s invaluable.
Second, it’s an interesting window into the past.
Of course, being almost 100 years old, parts of the book are wildly outdated. For example there’s a whole section on how to select charting paper, and how to draw your charts by hand. Information which is obviously useless, if you’re only looking for practical advice.
But if you’re like me, and enjoy learning about how things worked in the past, it’s fascinating to see how some things have changed, while some things have not changed at all.
Because technology has changed so much, the practical side of things are completely different now — from Schabacker’s hand-drawn graphs and mail-in stock broker orders, to today’s TradingView and 24/7 decentralized crypto exchanges.
But because the human psychology is mostly the same, the patterns that show up on the charts remain the same — the rectangles, the triangles, the head & shoulders, they all still show up in today’s charts, just like they did a hundred years ago.
Some things change, some things stay the same.
Should You Read This Book?
So is this book for you?
It depends.
Are you a novice, interested in learning the basics of technical analysis? Then honestly there are better ways to learn than reading this book. I would recommend you to start with Stockcharts’ guide to chart analysis, and follow Aksel Kibar’s work. Then further along your journey, you should come back to this book.
Are you already familiar with the basics, and interested in deepening your knowledge? Then you should absolutely read this book. Not just for the practical information, but also for a deeper sense of the rich history of technical analysis.
Richard W. Schabacker died that Saturday in September, but his legacy lives on.